
Technology
Henry Zavriyev Announces the Opening of Aisle24 at Residence Mont Carmel, Elevating the Retail Experience in the Heart of Montreal.


Technology
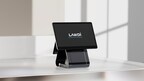
LANDI Global Unveils Flagship Cx20: Elevating business efficiency and customer experience with a next-generation Windows-powered terminal
Technology
Thinkpal learning tablet from Think Academy wins TechRadar Pro Picks and Trusted Reviews Best in Show awards at CES 2025


Technology27 minutes ago
LANDI Global Unveils Flagship Cx20: Elevating business efficiency and customer experience with a next-generation Windows-powered terminal
Technology27 minutes ago
CSI Companies Acquires MedSys Group, Expanding Healthcare IT Services

Technology1 hour ago
Thinkpal learning tablet from Think Academy wins TechRadar Pro Picks and Trusted Reviews Best in Show awards at CES 2025

Near Videos3 years ago
Whiteboard Series with NEAR | Ep: 45 Joel Thorstensson from ceramic.network

Technology2 years ago
Peloton Unveils Holiday 2022 Creative Campaign Highlighting How Motivation Transcends Beyond the Workout

Fashion8 years ago
These ’90s fashion trends are making a comeback in 2017

Near Videos3 years ago
Why You Should Build on #NEAR – Co-founder Illia Polosukhin at CV Labs
Near Videos3 years ago
Whiteboard Series with NEAR | Ep: 45 Joel Thorstensson from ceramic.network

Near Videos3 years ago
NEAR End of Year Town Hall 2021: The Open Web World, MetaBUILD 2 Hackathon and 2021 recap
-

 Coin Market4 days ago
Czech National Bank governor weighs Bitcoin for future reserve strategy
-

 Coin Market4 days ago
Toyota’s AI and Robotics-powered ‘Woven City’ set to open this year
-

 Coin Market4 days ago
US CFTC chair to step down, flags urgent need for crypto regulation
-

 Coin Market4 days ago
Telegram answered 900 US requests for user data in 2024: Report
-

 Coin Market4 days ago
KULR Technology predicts $200K Bitcoin price after buying $97K dip
-

 Near Videos5 days ago
Zcash Privacy: Guaranteed or Not?
-

 Coin Market4 days ago
Backpack Exchange acquires FTX EU, plans Q1 2025 launch
-

 Coin Market4 days ago
New Solana proposal aims to fix scalability issues with ‘lattice’ system