
Technology
Vipshop Reports Unaudited Second Quarter 2024 Financial Results
Published
5 months agoon
By
Conference Call to Be Held at 7:30 A.M. U.S. Eastern Time on August 20, 2024
GUANGZHOU, China, Aug. 20, 2024 /PRNewswire/ — Vipshop Holdings Limited (NYSE: VIPS), a leading online discount retailer for brands in China (“Vipshop” or the “Company”), today announced its unaudited financial results for the quarter ended June 30, 2024.
Second Quarter 2024 Highlights
Total net revenues for the second quarter of 2024 were RMB26.9 billion (US$3.7 billion), compared with RMB27.9 billion in the prior year period.GMV[1] for the second quarter of 2024 was RMB50.6 billion, which largely stayed flat compared with that in the prior year period.Gross profit for the second quarter of 2024 increased by 2.2% year over year to RMB6.3 billion (US$872.6 million) from RMB6.2 billion in the prior year period. Net income attributable to Vipshop’s shareholders for the second quarter of 2024 was RMB1.9 billion (US$265.7 million), compared with RMB2.1 billion in the prior year period.Non-GAAP net income attributable to Vipshop’s shareholders[2] for the second quarter of 2024 was RMB2.2 billion (US$298.0 million), compared with RMB2.4 billion in the prior year period.The number of active customers[3] for the second quarter of 2024 was 44.3 million, compared with 45.6 million in the prior year period.Total orders[4] for the second quarter of 2024 were 197.8 million, compared with 213.8 million in the prior year period.
Mr. Eric Shen, Chairman and Chief Executive Officer of Vipshop, stated, “Our second quarter results reflected the agility of our team and the resilience of our business model, as we achieved operational excellence in the face of slower sales momentum. The fundamental strength of our business was evidenced by the resilient performance of our core brands and active Super VIP members. In the second quarter, we continued to sharpen our focus on enriching merchandise offerings, delivering value, and providing worry-free services, which are our core competitive edges. Looking ahead, we will stay close to customer needs, continue investing in our merchandising capabilities, and consistently execute on the discount retail fundamentals to achieve quality growth for the long term.”
Mr. Mark Wang, Chief Financial Officer of Vipshop, further commented, “In the second quarter, we achieved solid profitability despite ongoing pressure on the topline growth. Our continued efforts in operating efficiency improvement helped us maintain consistent and healthy margins. Moreover, we accelerated our pace of preserving shareholder value with over US$200 million having been utilized for share buybacks during the quarter, and a new share repurchase program of up to US$1 billion will be in place after we fully utilize the remaining amount under the existing program. While uncertainties remain in the near term, we believe that our disciplined approach to managing the business, along with the long-term investments we are making in line with our strategy, positions us well to deliver sustainable and profitable growth in the long run.”
Second Quarter 2024 Financial Results
REVENUES
Total net revenues for the second quarter of 2024 were RMB26.9 billion (US$3.7 billion), compared with RMB27.9 billion in the prior year period.
GROSS PROFIT
Gross profit for the second quarter of 2024 increased by 2.2% year over year to RMB6.3 billion (US$872.6 million) from RMB6.2 billion in the prior year period. Gross margin for the second quarter of 2024 increased to 23.6% from 22.2% in the prior year period.
OPERATING EXPENSES
Total operating expenses for the second quarter of 2024 decreased by 4.2% year over year to RMB4.3 billion (US$590.8 million) from RMB4.5 billion in the prior year period. As a percentage of total net revenues, total operating expenses for the second quarter of 2024 decreased to 16.0% from 16.1% in the prior year period.
Fulfillment expenses for the second quarter of 2024 decreased by 0.8% year over year to RMB2.16 billion (US$297.9 million) from RMB2.18 billion in the prior year period. As a percentage of total net revenues, fulfillment expenses for the second quarter of 2024 was 8.1%, compared with 7.8% in the prior year period.Marketing expenses for the second quarter of 2024 decreased by 17.0% year over year to RMB740.7 million (US$101.9 million) from RMB892.5 million in the prior year period. As a percentage of total net revenues, marketing expenses for the second quarter of 2024 decreased to 2.8% from 3.2% in the prior year period.Technology and content expenses for the second quarter of 2024 increased by 10.0% year over year to RMB487.2 million (US$67.0 million) from RMB443.0 million in the prior year period. As a percentage of total net revenues, technology and content expenses for the second quarter of 2024 was 1.8%, compared with 1.6% in the prior year period.General and administrative expenses for the second quarter of 2024 decreased by 6.5% year over year to RMB900.7 million (US$123.9 million) from RMB963.1 million in the prior year period. As a percentage of total net revenues, general and administrative expenses for the second quarter of 2024 decreased to 3.4% from 3.5% in the prior year period.
INCOME FROM OPERATIONS
Income from operations for the second quarter of 2024 increased by 16.5% year over year to RMB2.2 billion (US$307.2 million) from RMB1.9 billion in the prior year period. Operating margin for the second quarter of 2024 increased to 8.3% from 6.9% in the prior year period.
Non-GAAP income from operations[5] for the second quarter of 2024, which excluded share-based compensation expenses, increased by 11.6% year over year to RMB2.6 billion (US$352.9 million) from RMB2.3 billion in the prior year period. Non-GAAP operating margin[6] for the second quarter of 2024 increased to 9.5% from 8.2% in the prior year period.
NET INCOME
Net income attributable to Vipshop’s shareholders for the second quarter of 2024 was RMB1.9 billion (US$265.7 million), compared with RMB2.1 billion in the prior year period. Net margin attributable to Vipshop’s shareholders for the second quarter of 2024 was 7.2%, compared with 7.5% in the prior year period. Net income attributable to Vipshop’s shareholders per diluted ADS[7] for the second quarter of 2024 was RMB3.49 (US$0.48), compared with RMB3.75 in the prior year period.
Non-GAAP net income attributable to Vipshop’s shareholders for the second quarter of 2024, which excluded (i) share-based compensation expenses, (ii) impairment loss of investments, (iii) investment (gain) loss and revaluation of investments excluding dividends, (iv) reconciling items on the share of equity method investments, and (v) tax effects on non-GAAP adjustments, was RMB2.2 billion (US$298.0 million), compared with RMB2.4 billion in the prior year period. Non-GAAP net margin attributable to Vipshop’s shareholders[8] for the second quarter of 2024 was 8.1%, compared with 8.6% in the prior year period. Non-GAAP net income attributable to Vipshop’s shareholders per diluted ADS[9] for the second quarter of 2024 was RMB3.91 (US$0.54), compared with RMB4.30 in the prior year period.
For the quarter ended June 30, 2024, the Company’s weighted average number of ADSs used in computing diluted income per ADS was 553,677,165.
BALANCE SHEET AND CASH FLOW
As of June 30, 2024, the Company had cash and cash equivalents and restricted cash of RMB21.6 billion (US$3.0 billion) and short term investments of RMB1.9 billion (US$264.3 million).
For the quarter ended June 30, 2024, net cash generated from operating activities was RMB287.1 million (US$39.5 million), and free cash flow[10], a non-GAAP measurement of liquidity, was as follows:
For the three months ended
June 30, 2023
RMB’000
June 30, 2024
RMB’000
June 30, 2024
US$’000
Net cash generated from operating activities
4,053,402
287,090
39,505
Reconciling items:
Net impact from internet financing activities[11]
199,429
27,193
3,742
Capital expenditures
(1,658,548)
(1,178,086)
(162,110)
Free cash inflow (outflow)
2,594,283
(863,803)
(118,863)
For the trailing twelve months ended
June 30, 2023
RMB’000
June 30, 2024
RMB’000
June 30, 2024
US$’000
Net cash generated from operating activities
11,764,313
9,626,765
1,324,687
Reconciling items:
Net impact from internet financing activities
315,313
(84,782)
(11,666)
Capital expenditures
(3,906,017)
(4,360,210)
(599,985)
Free cash inflow
8,173,609
5,181,773
713,036
Share Repurchase Program
During the quarter ended June 30, 2024, the Company repurchased US$205.9 million of its ADSs under its current US$1 billion share repurchase program, which is effective through March 2025. As of June 30, 2024, the Company has an unutilized amount of US$330.3 million under this program.
The board of directors has authorized a new share repurchase program under which the Company may repurchase up to US$1 billion of its American depositary shares or Class A ordinary shares for a 24-month period commencing from the full utilization of the existing share repurchase program adopted in March 2023, as amended.
The Company will implement its share repurchases in accordance with applicable rules and requirements under the Securities Exchange Act of 1934, as amended, and the Company’s insider trading policy. The Company’s board of directors will review the share repurchase programs periodically, and may authorize adjustment of their terms and size. The Company expects to fund the repurchases out of its existing cash balance.
Amended and Restated 2014 Share Incentive Plan
The Company adopted an Amended and Restated 2014 Share Incentive Plan, as approved and authorized by the board of directors of the Company and its compensation committee. This plan amends and restates the original plan in its entirety, primarily for the purpose of extending the term of the original plan, and assumes all awards granted under the original plan. The Amended and Restated 2014 Share Incentive Plan will expire upon the tenth anniversary of the effective date.
Business Outlook
For the third quarter of 2024, the Company expects its total net revenues to be between RMB20.5 billion and RMB21.6 billion, representing a year-over-year decrease of approximately 10% to 5%. These forecasts reflect the Company’s current and preliminary view on the market and operational conditions, which is subject to change.
Exchange Rate
The Company’s business is primarily conducted in China and the significant majority of revenues generated are denominated in Renminbi. This announcement contains currency translations of Renminbi amounts into U.S. dollars solely for the convenience of the reader. Unless otherwise noted, all translations from Renminbi to U.S. dollars are made at a rate of RMB7.2672 to US$1.00, the effective noon buying rate on June 28, 2024 as set forth in the H.10 statistical release of the Federal Reserve Board. No representation is made that the Renminbi amounts could have been, or could be, converted, realized or settled into U.S. dollars at that rate on June 28, 2024, or at any other rate.
Conference Call Information
The Company will hold a conference call on Tuesday, August 20, 2024 at 7:30 am U.S. Eastern Time, 7:30 pm Beijing Time to discuss the financial results.
All participants wishing to join the conference call must pre-register online using the link provided below.
Registration Link: https://register.vevent.com/register/BIfbccf9124acb48109bcc343f7ada8c5b
Once pre-registration has been completed, each participant will receive dial-in numbers and a unique access PIN via email. To join the conference, participants should use the dial-in details followed by the PIN code.
A live webcast of the earnings conference call can be accessed at https://edge.media-server.com/mmc/p/7y28oi6a. An archived webcast will be available at the Company’s investor relations website at http://ir.vip.com.
About Vipshop Holdings Limited
Vipshop Holdings Limited is a leading online discount retailer for brands in China. Vipshop offers high quality and popular branded products to consumers throughout China at a significant discount to retail prices. Since it was founded in August 2008, the Company has rapidly built a sizeable and growing base of customers and brand partners. For more information, please visit https://ir.vip.com/.
Safe Harbor Statement
This announcement contains forward-looking statements. These statements are made under the “safe harbor” provisions of the U.S. Private Securities Litigation Reform Act of 1995. These forward-looking statements can be identified by terminology such as “will,” “expects,” “anticipates,” “future,” “intends,” “plans,” “believes,” “estimates,” and similar statements. Among other things, the business outlook and quotations from management in this announcement, as well as Vipshop’s strategic and operational plans, contain forward-looking statements. Vipshop may also make written or oral forward-looking statements in its periodic reports to the U.S. Securities and Exchange Commission (the “SEC”), in its annual report to shareholders, in press releases and other written materials, and in oral statements made by its officers, directors, or employees to third parties. Statements that are not historical facts, including statements about Vipshop’s beliefs and expectations, are forward-looking statements. Forward-looking statements involve inherent risks and uncertainties. A number of factors could cause actual results to differ materially from those contained in any forward-looking statement, including but not limited to the following: Vipshop’s goals and strategies; Vipshop’s future business development, results of operations and financial condition; the expected growth of the online discount retail market in China; Vipshop’s ability to attract customers and brand partners and further enhance its brand recognition; Vipshop’s expectations regarding needs for and market acceptance of flash sales products and services; competition in the discount retail industry; fluctuations in general economic and business conditions in China and assumptions underlying or related to any of the foregoing. Further information regarding these and other risks is included in Vipshop’s filings with the SEC. All information provided in this press release is as of the date of this press release, and Vipshop does not undertake any obligation to update any forward-looking statement, except as required under applicable law.
Use of Non-GAAP Financial Measures
The condensed consolidated financial information is derived from the Company’s unaudited interim condensed consolidated financial statements prepared in conformity with accounting principles generally accepted in the United States of America (“U.S. GAAP”), except that cash flows for the period presented and the detailed footnote disclosures required by Accounting Standards Codification 270, Interim Reporting (“ASC270”) have been omitted. Vipshop uses non-GAAP net income attributable to Vipshop’s shareholders, non-GAAP net income attributable to Vipshop’s shareholders per diluted ADS, non-GAAP income from operations, non-GAAP operating margin, non-GAAP net margin attributable to Vipshop’s shareholders, and free cash flow, each of which is a non-GAAP financial measure. For the periods presented in this press release, non-GAAP net income attributable to Vipshop’s shareholders is net income attributable to Vipshop’s shareholders excluding (i) share-based compensation expenses, (ii) impairment loss of investments, (iii) investment (gain) loss and revaluation of investments excluding dividends, (iv) reconciling items on the share of equity method investments, and (v) tax effects on non-GAAP adjustments. Non-GAAP net income attributable to Vipshop’s shareholders per diluted ADS is computed using non-GAAP net income attributable to Vipshop’s shareholders divided by weighted average number of diluted ADS outstanding for computing diluted earnings per ADS. Non-GAAP income from operations is income from operations excluding share-based compensation expenses. Non-GAAP operating margin is non-GAAP income from operations as a percentage of total net revenues. Non-GAAP net margin attributable to Vipshop’s shareholders is non-GAAP net income attributable to Vipshop’s shareholders as a percentage of total net revenues. Free cash flow is net cash from operating activities adding back the impact from internet financing activities and less capital expenditures, which include purchase and deposits of property and equipment and land use rights. Impact from internet financing activities added back or deducted from free cash flow contains changes in the balances of financial products, which are primarily consumer financing and supplier financing that the Company provides to customers and suppliers. The Company believes that separate analysis and exclusion of the non-cash impact of (i) share-based compensation expenses, (ii) impairment loss of investments, (iii) investment (gain) loss and revaluation of investments excluding dividends, (iv) reconciling items on the share of equity method investments, and (v) tax effects on non-GAAP adjustments add clarity to the constituent parts of its performance. The Company reviews these non-GAAP financial measures together with GAAP financial measures to obtain a better understanding of its operating performance. It uses these non-GAAP financial measures for planning, forecasting, and measuring results against the forecast. The Company believes that non-GAAP financial measures are useful supplemental information for investors and analysts to assess its operating performance without the effect of (i) share-based compensation expenses, (ii) impairment loss of investments, (iii) investment (gain) loss and revaluation of investments excluding dividends, (iv) reconciling items on the share of equity method investments, and (v) tax effects on non-GAAP adjustments. Free cash flow enables the Company to assess liquidity and cash flow, taking into account the impact from internet financing activities and the financial resources needed for the expansion of fulfillment infrastructure, technology platform, and Shan Shan Outlets. Share-based compensation expenses have been and will continue to be significant recurring expenses in its business. However, the use of non-GAAP financial measures has material limitations as an analytical tool. One of the limitations of using non-GAAP financial measures is that they do not include all items that impact the Company’s net income for the period. In addition, because non-GAAP financial measures are not measured in the same manner by all companies, they may not be comparable to other similar titled measures used by other companies. One of the key limitations of free cash flow is that it does not represent the residual cash flow available for discretionary expenditures.
The presentation of these non-GAAP financial measures is not intended to be considered in isolation from, or as a substitute for, the financial information prepared and presented in accordance with U.S. GAAP. For more information on these non-GAAP financial measures, please see the table captioned “Vipshop Holdings Limited Reconciliations of GAAP and Non-GAAP Results” at the end of this release.
Investor Relations Contact
Tel: +86 (20) 2233-0732
Email: IR@vipshop.com
[1] “Gross merchandise value (GMV)” is defined as the total Renminbi value of all products and services sold through the Company’s online sales business, online marketplace platform, Shan Shan Outlets, and other offline stores during the given period, including the Company’s websites and mobile apps, third-party websites and mobile apps, Shan Shan Outlets, and other offline stores, which were fulfilled by either the Company or its third-party merchants, regardless of whether or not the goods were delivered or returned. GMV includes shipping charges paid by buyers to sellers. For prudent considerations, the Company does not consider products or services to be sold if the orders were placed and canceled pre-shipment and only included orders that left the Company’s or other third-party vendors’ warehouses.
[2] Non-GAAP net income attributable to Vipshop’s shareholders is a non-GAAP financial measure, which, for the periods presented in this press release, is defined as net income attributable to Vipshop’s shareholders excluding (i) share-based compensation expenses, (ii) impairment loss of investments, (iii) investment (gain) loss and revaluation of investments excluding dividends, (iv) reconciling items on the share of equity method investments, and (v) tax effects on non-GAAP adjustments.
[3] “Active customers” is defined as registered members who have purchased from the Company’s self-operated online sales business or the Company’s online marketplace platforms, excluding those who made their purchases from the Company’s online stores operated at third-party platforms, at least once during the relevant period. Beginning in the fourth quarter of 2023, the Company updated its definition of “active customers” to exclude registered members who make their purchases from the Company’s online stores operated at third-party platforms. The active customer figures for the historical periods presented in this press release have been retrospectively adjusted accordingly.
[4] “Total orders” is defined as the total number of orders placed during the given period, including the orders for products and services sold through the Company’s online sales business and on the Company’s online marketplace platforms (excluding, for the avoidance of doubt, orders from the Company’s offline stores and outlets), net of orders returned.
[5] Non-GAAP income from operations is a non-GAAP financial measure, which is defined as income from operations excluding share-based compensation expenses.
[6] Non-GAAP operating margin is a non-GAAP financial measure, which is defined as non-GAAP income from operations as a percentage of total net revenues.
[7] “ADS” means American depositary share, each of which represents 0.2 Class A ordinary share.
[8] Non-GAAP net margin attributable to Vipshop’s shareholders is a non-GAAP financial measure, which is defined as non-GAAP net income attributable to Vipshop’s shareholders, as a percentage of total net revenues.
[9] Non-GAAP net income attributable to Vipshop’s shareholders per diluted ADS is a non-GAAP financial measure, which is defined as non-GAAP net income attributable to Vipshop’s shareholders, divided by the weighted average number of diluted ADSs outstanding for computing diluted earnings per ADS.
[10] Free cash flow is a non-GAAP financial measure, which is defined as net cash from operating activities adding back the impact from internet financing activities and less capital expenditures, which include purchase and deposits of property and equipment and land use rights.
[11] Net impact from internet financing activities represents net cash flow relating to the Company’s financial products, which are primarily consumer financing and supplier financing that the Company provides to its customers and suppliers.
Vipshop Holdings Limited
Unaudited Condensed Consolidated Statements of Income and Comprehensive Income
(In thousands, except for share and per share data)
Three Months Ended
Six Months Ended
June 30,2023
June 30,2024
June 30,2024
June 30,2023
June 30,2024
June 30,2024
RMB’000
RMB’000
USD’000
RMB’000
RMB’000
USD’000
Product revenues
26,163,113
25,077,607
3,450,794
52,100,943
50,924,737
7,007,477
Other revenues (1)
1,716,187
1,797,561
247,353
3,314,740
3,596,311
494,869
Total net revenues
27,879,300
26,875,168
3,698,147
55,415,683
54,521,048
7,502,346
Cost of revenues
(21,677,355)
(20,533,956)
(2,825,566)
(43,309,175)
(41,634,335)
(5,729,075)
Gross profit
6,201,945
6,341,212
872,581
12,106,508
12,886,713
1,773,271
Operating expenses:
Fulfillment expenses (2)
(2,181,066)
(2,164,681)
(297,870)
(3,964,897)
(4,150,206)
(571,087)
Marketing expenses
(892,505)
(740,662)
(101,918)
(1,729,399)
(1,431,546)
(196,987)
Technology and content expenses
(443,046)
(487,156)
(67,035)
(835,809)
(969,057)
(133,347)
General and administrative expenses
(963,117)
(900,671)
(123,936)
(2,010,788)
(1,829,758)
(251,783)
Total operating expenses
(4,479,734)
(4,293,170)
(590,759)
(8,540,893)
(8,380,567)
(1,153,204)
Other operating income
194,288
184,380
25,372
336,577
485,978
66,873
Income from operations
1,916,499
2,232,422
307,194
3,902,192
4,992,124
686,940
Investment gain (loss) and revaluation of investments
39,354
(17,855)
(2,457)
81,334
(21,413)
(2,947)
Impairment loss of investments
(19,105)
(14,691)
(2,022)
(19,105)
(14,691)
(2,022)
Interest expense
(1,989)
(13,666)
(1,881)
(7,696)
(24,221)
(3,333)
Interest income
183,168
191,656
26,373
405,133
407,713
56,103
Exchange gain (loss)
282,636
(74,896)
(10,306)
274,449
(77,263)
(10,632)
Income before income tax expense and share of income of equity
method investees
2,400,563
2,302,970
316,901
4,636,307
5,262,249
724,109
Income tax expenses
(339,056)
(405,646)
(55,819)
(729,201)
(1,024,932)
(141,035)
Share of income of equity method investees
49,202
47,203
6,495
81,009
55,138
7,587
Net income
2,110,709
1,944,527
267,577
3,988,115
4,292,455
590,661
Net income attributable to non-controlling interests
(13,255)
(13,320)
(1,833)
(31,931)
(44,538)
(6,129)
Net income attributable to Vipshop’s shareholders
2,097,454
1,931,207
265,744
3,956,184
4,247,917
584,532
Shares used in calculating earnings per share (3):
Weighted average number of Class A and Class B ordinary
shares:
—Basic
110,053,473
108,709,998
108,709,998
112,975,907
108,584,522
108,584,522
—Diluted
111,819,666
110,735,433
110,735,433
114,669,108
110,708,271
110,708,271
Net earnings per Class A and Class B ordinary share
Net income attributable to Vipshop’s shareholders——Basic
19.06
17.76
2.44
35.02
39.12
5.38
Net income attributable to Vipshop’s shareholders——Diluted
18.76
17.44
2.40
34.50
38.37
5.28
Net earnings per ADS (1 ordinary share equals to 5 ADSs)
Net income attributable to Vipshop’s shareholders——Basic
3.81
3.55
0.49
7.00
7.82
1.08
Net income attributable to Vipshop’s shareholders——Diluted
3.75
3.49
0.48
6.90
7.67
1.06
(1) Other revenues primarily consist of product promotion and online advertising revenues, lease income mainly earned from the
Shan Shan Outlets ,fees charged to third-party merchants which the Company provides platform access for sales of their products,
revenue from third-party logistics services, loan facilitation service income and membership fee income.
(1) Other revenues primarily consist of product promotion and online
advertising revenues, lease income mainly earned from the Shan
Shan Outlets, fees charged to third-party merchants which the
Company provides platform access for sales of their products,
revenue from third-party logistics services, loan facilitation service
income and membership fee income.
(2) Fulfillment expenses include shipping and handling expenses, which amounted RMB 1.6 billion and RMB1.5 billion in the three
month periods ended June 30,2023 and June 30,2024, respectively.
(2) Fulfillment expenses include shipping and handling expenses,
which amounted RMB2.9 billion and RMB2.9 billion in the six month
periods ended June 30,2023 and June 30,2024, respectively.
(3) Authorized share capital is re-classified and re-designated into Class A ordinary shares and Class B ordinary shares, with each
Class A ordinary share being entitled to one vote and each Class B ordinary share being entitled to ten votes on all matters that are
subject to shareholder vote.
(3) Authorized share capital is re-classified and re-designated into
Class A ordinary shares and Class B ordinary shares, with each
Class A ordinary share being entitled to one vote and each Class B
ordinary share being entitled to ten votes on all matters that are
subject to shareholder vote.
Three Months Ended
Six Months Ended
June 30,2023
June 30,2024
June 30,2024
June 30,2023
June 30,2024
June 30,2024
RMB’000
RMB’000
USD’000
RMB’000
RMB’000
USD’000
Share-based compensation expenses are included in the
operating expenses as follows:
Fulfillment expenses
23,173
20,727
2,852
38,542
41,091
5,654
Marketing expenses
8,383
7,516
1,034
17,711
15,335
2,110
Technology and content expenses
92,906
96,856
13,328
154,273
190,288
26,185
General and administrative expenses
256,996
206,985
28,482
475,076
380,832
52,404
Total
381,458
332,084
45,696
685,602
627,546
86,353
Vipshop Holdings Limited
Unaudited Condensed Consolidated Balance Sheets
(In thousands, except for share and per share data)
December 31,2023
June 30,2024
June 30,2024
RMB’000
RMB’000
USD’000
ASSETS
CURRENT ASSETS
Cash and cash equivalents
25,414,729
21,030,780
2,893,932
Restricted cash
882,637
587,796
80,883
Short term investments
1,983,201
1,920,872
264,321
Accounts receivable, net
778,767
932,010
128,249
Amounts due from related parties,net
553,502
574,880
79,106
Other receivables and prepayments,net
2,298,612
2,529,655
348,092
Loan receivables,net
4,437
5,476
754
Inventories
5,644,713
4,172,868
574,206
Total current assets
37,560,598
31,754,337
4,369,543
NON-CURRENT ASSETS
Property and equipment, net
16,882,100
17,585,608
2,419,860
Deposits for property and equipment
200,739
178,269
24,531
Land use rights, net
10,132,626
10,433,786
1,435,737
Intangible assets, net
332,821
329,733
45,373
Investment in equity method investees
2,155,561
2,063,075
283,889
Other investments
2,916,189
3,163,209
435,272
Other long-term assets
147,669
237,930
32,740
Goodwill
755,213
755,213
103,921
Deferred tax assets, net
685,017
689,995
94,946
Operating lease right-of-use assets
554,061
459,412
63,217
Total non-current assets
34,761,996
35,896,230
4,939,486
TOTAL ASSETS
72,322,594
67,650,567
9,309,029
LIABILITIES AND EQUITY
CURRENT LIABILITIES
Short term loans
1,425,576
2,485,533
342,021
Accounts payable
17,259,395
12,225,160
1,682,238
Advance from customers
1,689,881
1,319,266
181,537
Accrued expenses and other current liabilities
9,560,449
8,029,983
1,104,963
Amounts due to related parties
150,373
184,165
25,342
Deferred income
457,594
432,360
59,495
Operating lease liabilities
80,868
66,052
9,089
Total current liabilities
30,624,136
24,742,519
3,404,685
NON-CURRENT LIABILITIES
Deferred tax liability
692,492
647,273
89,068
Deferred income-non current
1,756,949
1,951,942
268,596
Operating lease liabilities
689,259
607,278
83,564
Total non-current liabilities
3,138,700
3,206,493
441,228
TOTAL LIABILITIES
33,762,836
27,949,012
3,845,913
EQUITY:
Class A ordinary shares (US$0.0001 par value, 483,489,642
shares authorized,98,877,929 and 99,958,367 shares issued,of
which 92,900,247 and 91,129,644 shares were outstanding as of
December 31,2023 and June 30,2024, respectively)
62
63
9
Class B ordinary shares (US$0.0001 par value, 16,510,358 shares
authorized, and 15,560,358 and 15,560,358 shares issued and
outstanding as of December 31, 2023 and June 30,2024,
respectively)
11
11
2
Treasury shares,at cost(5,977,682 and 8,828,723 Class A shares
as of December 31,2023 and June 30,2024, respectively )
(3,624,763)
(5,205,735)
(716,333)
Additional paid-in capital
4,444,755
4,751,653
653,849
Retained earnings
36,836,928
39,414,170
5,423,570
Accumulated other comprehensive loss
(695,589)
(684,551)
(94,197)
Non-controlling interests
1,598,354
1,425,944
196,216
Total shareholders’ equity
38,559,758
39,701,555
5,463,116
TOTAL LIABILITIES AND SHAREHOLDERS’ EQUITY
72,322,594
67,650,567
9,309,029
Vipshop Holdings Limited
Reconciliations of GAAP and Non-GAAP Results
Three Months Ended
Six Months Ended
June 30,2023
June 30,2024
June 30,2024
June 30,2023
June 30,2024
June 30,2024
RMB’000
RMB’000
USD’000
RMB’000
RMB’000
USD’000
Income from operations
1,916,499
2,232,422
307,194
3,902,192
4,992,124
686,940
Share-based compensation expenses
381,458
332,084
45,696
685,602
627,546
86,353
Non-GAAP income from operations
2,297,957
2,564,506
352,890
4,587,794
5,619,670
773,293
Net income attributable to Vipshop’s shareholders
2,097,454
1,931,207
265,744
3,956,184
4,247,917
584,532
Share-based compensation expenses
381,458
332,084
45,696
685,602
627,546
86,353
Impairment loss of investments
19,105
14,691
2,022
19,105
14,691
2,022
Investment (gain) loss and revaluation of investments excluding dividends
(39,352)
17,855
2,457
(81,333)
21,413
2,947
Reconciling items on the share of equity method investments(4)
(22,897)
(15,124)
(2,081)
(37,612)
(28,647)
(3,942)
Tax effects on non-GAAP adjustments
(34,432)
(115,297)
(15,865)
(71,390)
(134,789)
(18,548)
Non-GAAP net income attributable to Vipshop’s shareholders
2,401,336
2,165,416
297,973
4,470,556
4,748,131
653,364
(4) To exclude the GAAP to non-GAAP reconciling items relating to investment (gain) loss and revaluation of investments on the share of equity method investments.
Shares used in calculating earnings per share:
Weighted average number of Class A and Class B ordinary shares:
—Basic
110,053,473
108,709,998
108,709,998
112,975,907
108,584,522
108,584,522
—Diluted
111,819,666
110,735,433
110,735,433
114,669,108
110,708,271
110,708,271
Non-GAAP net income per Class A and Class B ordinary share
Non-GAAP net income attributable to Vipshop’s shareholders——Basic
21.82
19.92
2.74
39.57
43.73
6.02
Non-GAAP net income attributable to Vipshop’s shareholders——Diluted
21.48
19.55
2.69
38.99
42.89
5.90
Non-GAAP net income per ADS (1 ordinary share equal to 5 ADSs)
Non-GAAP net income attributable to Vipshop’s shareholders——Basic
4.36
3.98
0.55
7.91
8.75
1.20
Non-GAAP net income attributable to Vipshop’s shareholders——Diluted
4.30
3.91
0.54
7.80
8.58
1.18
View original content:https://www.prnewswire.com/news-releases/vipshop-reports-unaudited-second-quarter-2024-financial-results-302226220.html
SOURCE Vipshop Holdings Limited

You may like
Technology
ALTICE USA IS ABANDONING LOCAL SPORTS FANS AND IS KEEPING MSG NETWORKS AND ITS KNICKS, RANGERS, ISLANDERS AND DEVILS COVERAGE OFF THE AIR
Published
24 minutes agoon
January 10, 2025By
NEW YORK, Jan. 10, 2025 /PRNewswire/ — MSG Networks released the following statement about their dispute with Altice USA:
“Altice USA has pulled their last proposal and walked away from negotiations to bring MSG Networks back to its Optimum subscribers. They also just dropped WPIX Channel 11 in New York and other local stations around the country. If you have been waiting, like we have, for them to do right by their customers – don’t wait any longer. Now is the time to switch to Verizon Fios who has a special offer for Optimum subscribers. Meanwhile, Optimum has been charging their over 1 million customers for local sports programming they have not been receiving and EVERY subscriber should be credited at least $10 a month.
Verizon Fios is ready to take your business. If you are not in Verizon Fios area, you can get games through these other providers DirecTV, DirecTV Stream, Fubo and The Gotham Sports App. For more options on how to switch providers, visit www.keepMSG.com.”
About MSG Networks
MSG Networks, a pioneer in sports media, owns and operates two award-winning regional sports and entertainment networks (MSG and MSG Sportsnet) and MSG+, a direct-to-consumer and authenticated streaming offering (included in the Gotham Sports App), that serve the nation’s number one media market, the New York DMA, as well as other portions of New York, New Jersey, Connecticut and Pennsylvania. The networks feature a wide range of compelling sports content, including exclusive live local games and other programming of the New York Knicks, New York Rangers, New York Islanders, New Jersey Devils and Buffalo Sabres, as well as significant coverage of the New York Giants and Buffalo Bills. This content, in addition to a diverse array of other sporting events and critically acclaimed original programming, has established MSG Networks as the gold standard in regional sports. MSG Networks is part of the Sphere Entertainment Co. (NYSE: SPHR).
Contact:
Dan Schoenberg (dan.schoenberg@msg.com)
View original content to download multimedia:https://www.prnewswire.com/news-releases/altice-usa-is-abandoning-local-sports-fans-and-is-keeping-msg-networks-and-its-knicks-rangers-islanders-and-devils-coverage-off-the-air-302348428.html
SOURCE Sphere Entertainment Co.
Technology
Infor Nexus Unveils NexTrace, its End-to-End Traceability Solution at NRF 2025
Published
24 minutes agoon
January 10, 2025By
Leveraging AI technology and a supplier-centric philosophy, the solution simplifies the data collection process, helping to promote accuracy and compliance
NEW YORK, Jan. 10, 2025 /PRNewswire/ — Infor Nexus™ , the single-instance supply chain network platform providing unparalleled visibility and collaboration, today announced NexTrace. This innovative solution is designed to improve customer transparency and provide a competitive advantage. With the EU Digital Product Passport (DPP) set to take effect in 2027, companies need to start preparing now by implementing traceability solutions. NexTrace can give customers a head start to meet regulatory requirements like the EU DPP and the Corporate Sustainability Due Diligence Directive (CSDDD).
NexTrace provides end-to-end transparency by seamlessly tracking raw material through to finished products and beyond, ensuring full traceability throughout the entire supply chain journey. It integrates supplier ESG data and certificates for a holistic view of sustainability and compliance information. Leveraging AI technology and a supplier-centric philosophy, NexTrace simplifies the data collection process, ensuring accuracy and compliance.
“Last June, we launched Map and Trace, which empowers our customers to map their supply chains and collect documentation from multiple supplier tiers. Map and Trace provides evidence of chain of custody compliance with regulations such as the US UFLPA and the French AGEC law. With NexTrace, we’re taking this to the next level by proactively gathering full-scale item-level traceability from each tier of the supply chain. This will help our customers to not only meet upcoming regulations like the EU Digital Product Passport but also gain a competitive edge by providing comprehensive data on their products’ journey, composition, and sustainability,” said Brian Carelli, Infor VP, Sustainability and Partnerships.
Meeting regulatory and consumer demands for product traceability requires collaboration across supply chain tiers. By connecting to Infor Nexus, companies gain a head start, leveraging an established ecosystem of over 94,000 brands, retailers, and suppliers already on the platform. Managing traceability and chain-of-custody data alongside existing supply chain processes on a unified platform accelerates progress, boosts efficiency, and reduces reliance on multiple systems.
NexTrace Capability Highlights:
Enables seamless lot and item-level tracing by tracking the movement of raw material lots and batches through their conversion into finished products Leverages AI to collect data from the multiple tiers of suppliers, while automatically associating transactions from one tier to the next, helping to reduce the burden on suppliers and increase data accuracy and tracing efficiency Allows suppliers to upload data from existing reports in one easy step, rather than necessitating manual data entry RFID scanning of serialized barcodes at source automatically links the multi-tier chain of custody data Integrates supplier ESG data and certificates with traceability information, providing a comprehensive view of sustainability and compliance throughout the supply chain Creates a digital link and visualization to share traceability and product information with consumers, enhancing transparency and trust throughout the supply chain Tracing data automatically updates the network graph creating linkages between products and materials providing a higher fidelity map of your supply chain network
“Vendors will be eager to tout their Digital Product Passport solutions at NRF, but their focus is often on flashy features, rather than the minutiae of how to feed such data-hungry systems. At NRF, we look forward to demonstrating how trace data is built and how to scale a system of this magnitude,” said Carelli.
To learn more about building a more responsible supply chain, visit https://www.infor.com/solutions/scm/infor-nexus/sustainability
About Infor Nexus
Infor Nexus™ is the leading global supply chain platform. Infor Nexus connects a network of over 94,000 brands, retailers, manufacturers, suppliers, logistics providers and banks on single-instance network platform to seamlessly orchestrate global supply chain processes from source through to delivery and payment. Companies streamline their operations to eliminate inefficiencies and waste while gaining data-driven insights and optimizing the flow of capital for improved agility, resilience, and sustainability. Visit www.infor.com/solutions/scm/infor-nexus.
Media Contact:
Alexandria Truby
Senior Public Relations Specialist, Infor
Alexandria.Truby@infor.com
View original content to download multimedia:https://www.prnewswire.com/news-releases/infor-nexus-unveils-nextrace-its-end-to-end-traceability-solution-at-nrf-2025-302348430.html
SOURCE Infor
Technology
Security Camera Market to Grow by USD 3.85 Billion from 2025-2029, Driven by Video Analytics for Surveillance and AI-Powered Market Evolution – Technavio
Published
24 minutes agoon
January 10, 2025By
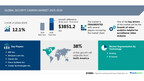
NEW YORK, Jan. 10, 2025 /PRNewswire/ — Report on how AI is driving market transformation – The global security camera market size is estimated to grow by USD 3.85 billion from 2025-2029, according to Technavio. The market is estimated to grow at a CAGR of 12.1% during the forecast period. Growth of video analytics helpful for surveillance video analyses is driving market growth, with a trend towards growing adoption of iot and smart homes. However, challenges regarding privacy and data loss poses a challenge. Key market players include ADT Inc., Amazon.com Inc., Canon Inc., Cisco Systems Inc., Costar Technologies Inc., Dahua Technology Co. Ltd., Hangzhou Hikvision Digital Technology Co. Ltd., Hanwha Techwin America, Honeywell International Inc., Johnson Controls International Plc, JVCKENWOOD Corp., Motorola Solutions Inc., Panasonic Holdings Corp., Robert Bosch GmbH, Schneider Electric SE, Simplisafe Inc., Sony Group Corp., Teledyne Technologies Inc., Vicon Industries Inc., and Xiaomi Inc..
Key insights into market evolution with AI-powered analysis. Explore trends, segmentation, and growth drivers- View Free Sample PDF
Security Camera Market Scope
Report Coverage
Details
Base year
2024
Historic period
2019 – 2023
Forecast period
2025-2029
Growth momentum & CAGR
Accelerate at a CAGR of 12.1%
Market growth 2025-2029
USD 3851.2 million
Market structure
Fragmented
YoY growth 2022-2023 (%)
9.9
Regional analysis
North America, APAC, Europe, South America, and Middle East and Africa
Performing market contribution
North America at 38%
Key countries
US, China, Germany, Canada, UK, France, Japan, India, South Korea, and Italy
Key companies profiled
ADT Inc., Amazon.com Inc., Canon Inc., Cisco Systems Inc., Costar Technologies Inc., Dahua Technology Co. Ltd., Hangzhou Hikvision Digital Technology Co. Ltd., Hanwha Techwin America, Honeywell International Inc., Johnson Controls International Plc, JVCKENWOOD Corp., Motorola Solutions Inc., Panasonic Holdings Corp., Robert Bosch GmbH, Schneider Electric SE, Simplisafe Inc., Sony Group Corp., Teledyne Technologies Inc., Vicon Industries Inc., and Xiaomi Inc.
The security camera market is experiencing significant growth due to increasing operational needs for safety and crime prevention. Traditional security cameras are being replaced by smart security solutions, including AI-powered appliances and IP cameras with high-definition and infrared capabilities. Innovations like facial recognition, motion detection, and anomaly detection are driving consumer interest. Cost-effective options, such as box cameras and dome cameras, offer ease of installation and scalability. Strategic partnerships and promotions are making advanced security solutions more accessible to homeowners and businesses. With the rise of the Internet of Things, cloud-based video surveillance and mobile surveillance systems are becoming essential for both home and commercial security. Despite investment costs, the benefits of AI-driven analytics, incident response times, and thermal imaging outweigh the risks of misuse and privacy concerns. Security camera systems are essential for crime prevention, border security, and critical infrastructure protection, making them a worthwhile investment for private properties and public spaces.
The Security Camera market is experiencing significant growth due to the increasing adoption of Internet of Things (IoT) devices, specifically smart cameras, for residential security. These advanced cameras come equipped with video analytics and recognition capabilities, enabling them to monitor and identify family members, pets, and objects. Consumers can record and view security events in real-time via their smartphones. Additionally, vendors offer smart doorbells and peepholes, replacing traditional models with cameras that detect people entering or exiting homes and monitor objects outside. Indoor smart cameras can also be used to monitor pets or babies from a distance.
Request Sample of our comprehensive report now to stay ahead in the AI-driven market evolution!
• The security camera market is witnessing significant growth due to the increasing operational needs for safety and crime prevention in various sectors. Traditional security solutions like analog surveillance and dome cameras are being replaced by smart security cameras with advanced features like infrared, AI-powered appliances, and high-definition cameras. These innovations offer benefits such as anomaly detection, facial recognition, and two-way audio. However, challenges include investment costs, ease of installation, and privacy concerns. In high-risk areas like border security and critical infrastructure, scalable AI-driven analytics and thermal imaging are essential. Homeowners seek cost-effective, smart home technology solutions with long battery life and remote control. Strategic partnerships and promotions drive consumer interest. Despite these advancements, security risks and privacy protections remain crucial considerations. Incident response times and evidence collection are essential for investigations. Smart city development and mobile surveillance systems offer new opportunities. Overall, the market requires continuous innovation to address operational needs and consumer demands.
• IP-based security cameras offer valuable surveillance solutions for businesses, but they also present significant cybersecurity risks. Hackers can launch various attacks, such as DDoS, MiTM, data breaches, APTs, and ransomware, exploiting vulnerabilities in these devices. Weak passwords and mass-produced, identical cameras make them easy targets. Compromised security cameras can disrupt networks and potentially provide a gateway to larger IT infrastructure breaches. Businesses must prioritize securing their IP-based security cameras to mitigate these risks.
Discover how AI is revolutionizing market trends- Get your access now!
This security camera market report extensively covers market segmentation by
Technology 1.1 Analog1.2 IP basedProduct Type2.1 HD and full-HD2.2 Non-HDGeography 3.1 North America3.2 APAC3.3 Europe3.4 South America3.5 Middle East and AfricaSystemApplicationFeatureCamera resolutionType
1.1 Analog- Analog cameras are a cost-effective solution for businesses seeking continuous surveillance through closed-circuit television (CCTV) systems. These cameras transmit video signals over cable to video cassette recorders (VCRs) and digital video recorders (DVRs), offering resolution ranges compliant with National Television Standards Committee (NTSC) and Phase Alternating Line (PAL) standards. Resolutions range from 420 to 1080 pixels, ensuring clear images. Analog cameras can connect via coax cables, twisted-pair cables, or wireless connections. Vendors provide advanced features such as infrared light-emitting diodes (IR LEDs) for night vision, 1080 pixels analog high definition (AHD), 1080 composite video interface (CVI), and complementary metal-oxide-semiconductor (CMOS) sensors with Infrared Cutfilter Removal (ICR) for accurate color reproduction. Cameras are built with Ingress Protection rated metal, safeguarding against dust, sand, rain, and snow. VCRs and DVRs are essential for video recording, with offerings up to 50 terabytes of storage, motion-detecting push notifications, remote viewing via smartphones, tablets, and computers, advanced recording and playback options, and scheduling recording 24/7 or by motion detection. Vendors also provide customer care services and a three-year warranty. Analog cameras are commonly used in city infrastructure surveillance, ATM banking outlets, construction sites, and indoor retail environments due to their affordability and advanced features. With a lower average selling price (ASP) and technological advancements like AHD and pan-tilt-zoom (PTZ), the analog segment will continue driving growth in the global security camera market.
Download a Sample of our comprehensive report today to discover how AI-driven innovations are reshaping competitive dynamics
The Security Camera Market encompasses various segments, including video surveillance systems, CCTV, and smart home security. Accessories such as lenses, mounts, and cables enhance the functionality of these systems. Security camera technology continues to evolve, offering advanced features like analytics, remote monitoring, and cloud-based solutions. Organizations across industries rely on security cameras for benefits like deterrence, evidence collection, and improved safety. Installation and integration with business systems are crucial considerations. Security camera pricing varies based on factors like resolution, type, and advanced features. Privacy concerns and cybersecurity are essential aspects of the security camera market. Standards and regulations ensure data protection. Comparison of different security camera solutions based on their features, advantages, and ROI is vital for making informed decisions. The market’s growth is driven by increasing security concerns, technological advancements, and the integration of security systems with other business solutions. Security camera revenue is expected to continue growing as demand for advanced and cost-effective solutions increases. Innovations like AI and machine learning are transforming the market, offering improved monitoring, analytics, and cybersecurity. Maintenance and software updates are essential for ensuring optimal performance and security. Security camera manufacturers cater to various applications, from residential to industrial, providing customized solutions to meet diverse needs. The market’s trends reflect the shift towards more advanced, cost-effective, and user-friendly systems.
The security camera market is experiencing significant growth due to the increasing operational needs for safety and crime prevention in various sectors. Traditional security solutions, such as analog surveillance cameras, are being replaced by innovative smart security cameras with features like infrared technology, AI-powered appliances, and high-definition cameras. These advanced security solutions offer benefits like anomaly detection, facial recognition, and two-way audio. Investment costs for security camera systems have decreased with the advent of scalable IP cameras and the Internet of Things. Smart city development and border security are major drivers of growth, with AI-driven analytics and cloud-based video surveillance becoming essential components. Consumers, including homeowners, are showing increased interest in smart home devices and security solutions, leading to promotions and discounts. Expertise in security camera installation and maintenance is crucial for effective surveillance coverage. In high-risk areas, security cameras are used to prevent incidents like burglary, unauthorized access, and intruders. Thermal imaging and motion detection are effective surveillance tools for crime prevention. However, privacy concerns and data protection laws necessitate privacy protections and data redundancy. Security risks and misuse are potential challenges, requiring strategic partnerships and incident response times. Scalability and cost-effectiveness are essential considerations for commercial security and mobile surveillance systems. Overall, the market for security cameras is continuously evolving with innovations like machine learning and deep learning engines.
1 Executive Summary
2 Market Landscape
3 Market Sizing
4 Historic Market Size
5 Five Forces Analysis
6 Market Segmentation
TechnologyAnalogIP BasedProduct TypeHD And Full-HDNon-HDGeographyNorth AmericaAPACEuropeSouth AmericaMiddle East And AfricaSystemApplicationFeatureCamera resolutionType
7 Customer Landscape
8 Geographic Landscape
9 Drivers, Challenges, and Trends
10 Company Landscape
11 Company Analysis
12 Appendix
Technavio is a leading global technology research and advisory company. Their research and analysis focuses on emerging market trends and provides actionable insights to help businesses identify market opportunities and develop effective strategies to optimize their market positions.
With over 500 specialized analysts, Technavio’s report library consists of more than 17,000 reports and counting, covering 800 technologies, spanning across 50 countries. Their client base consists of enterprises of all sizes, including more than 100 Fortune 500 companies. This growing client base relies on Technavio’s comprehensive coverage, extensive research, and actionable market insights to identify opportunities in existing and potential markets and assess their competitive positions within changing market scenarios.
Technavio Research
Jesse Maida
Media & Marketing Executive
US: +1 844 364 1100
UK: +44 203 893 3200
Email: media@technavio.com
Website: www.technavio.com/
View original content to download multimedia:https://www.prnewswire.com/news-releases/security-camera-market-to-grow-by-usd-3-85-billion-from-2025-2029–driven-by-video-analytics-for-surveillance-and-ai-powered-market-evolution—technavio-302346893.html
SOURCE Technavio

ALTICE USA IS ABANDONING LOCAL SPORTS FANS AND IS KEEPING MSG NETWORKS AND ITS KNICKS, RANGERS, ISLANDERS AND DEVILS COVERAGE OFF THE AIR
Infor Nexus Unveils NexTrace, its End-to-End Traceability Solution at NRF 2025

Security Camera Market to Grow by USD 3.85 Billion from 2025-2029, Driven by Video Analytics for Surveillance and AI-Powered Market Evolution – Technavio

Whiteboard Series with NEAR | Ep: 45 Joel Thorstensson from ceramic.network

Peloton Unveils Holiday 2022 Creative Campaign Highlighting How Motivation Transcends Beyond the Workout

These ’90s fashion trends are making a comeback in 2017

Why You Should Build on #NEAR – Co-founder Illia Polosukhin at CV Labs
Whiteboard Series with NEAR | Ep: 45 Joel Thorstensson from ceramic.network

NEAR End of Year Town Hall 2021: The Open Web World, MetaBUILD 2 Hackathon and 2021 recap
Trending
-

 Technology5 days ago
Amorepacific Named CES 2025 Innovation Award Honoree
-

 Technology5 days ago
NIKON EXHIBITS AT CES 2025
-

 Technology5 days ago
Partnered with Kiztopia, Creta Class Celebrates the Success of Jumptopia™ Triple Adventure at Marina Bay Sands
-

 Coin Market4 days ago
Toyota’s AI and Robotics-powered ‘Woven City’ set to open this year
-

 Coin Market3 days ago
US CFTC chair to step down, flags urgent need for crypto regulation
-

 Coin Market3 days ago
Telegram answered 900 US requests for user data in 2024: Report
-
 Technology5 days ago
Audio Foundry Unveils at CES 2025: Primax-Tymphany Group Drives Innovation in Smart Vehicle Technology
-

 Technology5 days ago
Tencent Cloud Recognized Again in the Gartner® “Competitive Landscape: Video Platform Services” Report, solidifying its Pioneering Position in the Asia-Pacific Market