
Technology
Gogoro Releases Second Quarter 2024 Financial Results
Published
1 month agoon
By
TAIPEI, Taiwan, Aug. 15, 2024 /PRNewswire/ — Gogoro Inc. (“Gogoro,” “the Company” or “We”) (Nasdaq: GGR), a global technology leader in battery swapping ecosystems that enable sustainable mobility solutions for cities, today released its financial results for its second quarter ended June 30, 2024.
Second Quarter 2024 Summary
Successfully closed two private placements: Gold Sino Assets Limited and Castrol Holdings International Limited invested $50 million and $25 million, respectively, to purchase ordinary shares of Gogoro.
Revenue of $80.9 million, down 7.2% year-over-year and down 2.4% on a constant currency basis.
Battery swapping service revenue of $34.7 million, up 4.0% year-over-year and up 9.5% on a constant currency basis.
Pulse, our new flagship Smartscooter, and JEGO, our new entry-level Smartscooter, continue to be in high demand with more than 6,500 backlog orders in the second quarter; revenue associated with these backlog orders in the second quarter is estimated to be $12.3 million that will not be recognized as revenue until vehicles are delivered which is expected to occur in the third quarter of 2024.
Sales of hardware and others revenue of $46.3 million, down 14.1% year-over-year and down 9.8% on a constant currency basis.
Gross margin of 5.2%, down from 15.2% in the same quarter last year. Non-IFRS gross margin of 13.0%, down 3.0% year-over-year.
Net loss of $20.1 million as compared to a net loss of $5.6 million in the same quarter last year.
Adjusted EBITDA of $11.6 million, down from $12.9 million in the same quarter last year.
“We are not satisfied with our financial performance for the first half of 2024 and are working to address our supply chain and manufacturing output to meet the increased demands for our new Pulse and JEGO Smartscooters in Taiwan. The 6,500 vehicle backlog orders in the second quarter of 2024 is expected to be realized as revenue in the third quarter of 2024 when these vehicles are delivered,” said Horace Luke, chairman, founder, and CEO of Gogoro. “In the second quarter, we secured a total of $75 million equity investments from Gold Sino Assets Limited and Castrol Holdings International Limited, which is part of the British Petroleum group. These investments demonstrate strong support for Gogoro’s business and vision for transitioning urban two-wheel mobility to cleaner and more sustainable energy. The cash proceeds strengthened our cash position and balance sheet and positioned us to fund our operational needs and continue our focus on global business expansion. Finally, we entered into a non-binding memorandum of understanding with Sumitomo Mitsui Finance and Leasing Company (“SMFL”) to pave the way for our asset-light international expansion.”
“Continuing to grow the Taiwan market requires a greater mix of products with a lower average selling price (“ASP”), ongoing operating capital investments, and the upgrading of certain battery packs to ensure we maximize the business opportunities of both the first and second life of these battery packs. We expect these factors to have a short-term negative impact on our revenue and earnings, and we saw that in the second quarter. Despite these short-term challenges, we continue to invest in our international expansion efforts, and are working tirelessly to deliver financial performance that shows progress — cautiously managing our operating expenses and inventory levels, growing our battery swapping revenue contribution, and investing prudently while markets develop. As a result of our efforts, we were able to increase our operating cash flow by approximately $10 million in the first half of 2024 compared to the first half of 2023, and we remain optimistic and confident in our long-term business model,” said Bruce Aitken, CFO of Gogoro.
Second Quarter 2024 Financial Overview
Operating Revenues
For the second quarter, the total revenue was $80.9 million, down 7.2% year-over-year and down 2.4% year-over-year on a constant currency basis1. Had foreign exchange rates remained constant with the average rate of the same quarter last year, revenue would have been up by an additional $4.2 million. We had more than 6,500 backlog orders for Pulse and JEGO in the second quarter with a total value of approximately $12.3 million, although customers have the right to cancel such orders prior to delivery. The large quantity of backlog orders is primarily the result of robust demand for these new models, coupled with our need to balance manufacturing capacity across multiple vehicles and the need to balance the related supply chain accordingly.
Battery swapping service revenue for the second quarter was $34.7 million, up 4.0% year-over-year, and up 9.5% year-over-year on a constant currency basis1. Total subscribers at the end of the second quarter exceeded 608,000, up 10.1% from 552,000 subscribers at the end of the same quarter last year.
The year-over-year increase in battery swapping service revenue was primarily due to our larger subscriber base compared to the same quarter last year and the high retention rate of our subscribers.
Sales of hardware and other revenues for the second quarter were $46.3 million, down 14.1% year-over-year, and down 9.8% year-over-year on a constant currency basis1. The year-over-year decrease in sales of hardware and other revenues was driven by a combination of factors: (i) a decrease of ASP due to a higher proportion of lower-priced vehicles sold, (ii) a significant increase in the level of undelivered backlog orders compared to the same quarter last year, (iii) a decrease in sales revenues associated with selling accessories and maintenance parts from original equipment manufacturers (“OEM”), and (iv) an unfavorable exchange rate when translating 95% of the sales denominated in NTD to USD.
The backlog orders for Pulse and JEGO we received in the second quarter are not reflected in the vehicle registration data published by the Taiwan government for the second quarter, nor did Gogoro recognize any revenue for these vehicles, despite receiving full payment from customers or approved financing from third-party financing companies. Gogoro will account for the vehicle revenue upon deliveries to customers.
The government-reported registration volume of powered two-wheelers (“PTW”) in the Taiwan market in the second quarter was up 2.0% year-over-year. While registrations of total electric PTW were reported to be up by 17.6% compared to the same quarter last year, those of Gogoro’s sales grew by 10.8%. Had we delivered the outstanding orders of Pulse and JEGO, the growth of electric PTW registrations contributed by sales of Gogoro vehicles would have been estimated to be 57.2%.
Taiwan’s two largest PTW manufacturers are publicly estimating that the total PTW market will shrink by 14% from last year’s 870,000 units to around 750,000 units in 2024. We updated our market outlook to regress toward the market consensus as we have seen a temporary slowdown in consumer transition from traditional internal combustion engine vehicles to electric PTW in the first half of 2024.
Gross Margin
For the second quarter, gross margin was 5.2%, down from 15.2% in the same quarter last year while non-IFRS gross margin1 was 13.0%, down from 16.0% in the same quarter last year. The decline in gross margin was primarily driven by a combination of factors: (i) a $6.0 million derecognition expenses on components removed from the battery pack and costs associated with our battery upgrade initiatives, (ii) a $1.7 million increase in depreciation and other costs associated with our new overseas production facilities, (iii) a decrease in ASP associated with an increase in sales of lower-priced models, (iv) a decrease in maintenance part sales through our own channel and a lower margin contribution from Gogoro OEM parts, and (v) higher franchise commission from selling hardware through authorized channels. These impacts, when combined, approximately account for the 10.0% decline in gross margin.
We continued to carry out one-time, voluntary upgrades on certain battery packs which are expected to take several quarters to complete, continuing into 2025. These upgrades provide multiple benefits — reduction of capital expenditures on replacing battery packs, increasing lifetime capacity of each battery pack (including extending its first mobility use-case useful life) and solidifying the extra lifetime capacity of each battery pack to validate our second-life thesis. These upgrades are expected to create economic benefits in the long run but do come at a short-term reduction in our gross margin as we carry out the upgrades. We expect our IFRS gross margin will continue to be impacted during our upgrades planned in 2024 and 2025. The upgrades will impact both our cash position and profit. We will only upgrade battery packs in instances where the value created over time exceeds the cost of the upgrade.
Net Loss
For the second quarter, net loss was $20.1 million, representing an increase of $14.5 million from a net loss of $5.6 million in the same quarter last year. The increase in net loss was due to a $9.3 million decrease of the favorable change in the fair value of financial liabilities associated with outstanding earnout shares, earn-in shares and warrants compared to the same quarter last year and the decrease of $9.1 million in gross profit mainly attributable to the ongoing upgrades to our battery packs. The increase in net loss was partially offset by the decrease of $4.8 million in operating expenses as a result of our cost management efforts.
Adjusted EBITDA
For the second quarter, adjusted EBITDA1 was $11.6 million, representing a decrease of $1.3 million from $12.9 million in the same quarter last year. The decrease was primarily due to a $3.4 million decrease in non-IFRS gross profit compared to the same quarter last year, which was partially offset by a $1.7 million decrease in expenses associated with risk management programs and new product development costs.
Liquidity
We continued to generate operating cash inflow in the second quarter through tightening our business operations and reducing working capital. In June 2024, we raised $50 million and $25 million through issuing ordinary shares to Gold Sino Assets Limited and Castrol Holdings International Limited, respectively, to fund our operations. We are continuously committed to investing in growth of our battery-swapping infrastructure. With a $196.9 million cash balance at the end of the second quarter of 2024 and the additional credit facilities that are available to us, we believe we have sufficient sources of funding to meet our near-term business growth objectives.
Updated 2024 Guidance
We are adjusting our revenue expectations for the year to a level lower than previously expected. The overall performance of the two-wheeler market in Taiwan is softer than anticipated and the strong sales of JEGO have resulted in ASP pressure on us. Our sales in India are also negatively impacted due to delays in clarity on government incentives as we are awaiting the full publication of battery swapping subsidy details under India’s Fame 3 policy, and are unwilling to self-subsidize in the meantime. As a result of these factors, we adjusted our guidance for full year revenue and are expecting to generate between $320 million to $345 million in 2024. In addition, we expect more than 95% of such revenue will be Taiwan-based.
Conference Call Information
Gogoro’s management team will hold an earnings Webcast on August 15th, 2024, at 8:00 a.m. Eastern Time to discuss the Company’s second quarter 2024 results of operations and outlook.
Investors may access the webcast, supplemental financial information and investor presentation at Gogoro’s investor relations website (https://investor.gogoro.com) under the “Events” section. A replay of the investor presentation and the earnings call script will be available 24 hours after the conclusion of the webcast and archived for one year.
About Gogoro
Founded in 2011 to rethink urban energy and inspire the world to move through cities in smarter and more sustainable ways, Gogoro leverages the power of innovation to change the way urban energy is distributed and consumed. Recognized by Fast Company as “Asia-Pacific’s Most Innovative Company of 2024″; Frost & Sullivan as the “2023 Global Company of the Year for battery swapping for electric two-wheel vehicles”; and MIT Technology Review as one of “15 Climate Tech Companies to Watch” in 2023, Gogoro’s battery swapping and vehicle platforms offer a smart, proven, and sustainable long-term ecosystem for delivering a new approach to urban mobility. Gogoro has quickly become an innovation leader in vehicle design and electric propulsion, smart battery design, battery swapping, and advanced cloud services that utilize artificial intelligence to manage battery charging and availability. The challenge is massive, but the opportunity to disrupt the status quo, establish new standards, and achieve new levels of sustainable transportation growth in densely populated cities is even greater. For more information, visit www.gogoro.com/news and follow Gogoro on Twitter: @wearegogoro.
Forward-Looking Statements
This communication contains forward-looking statements within the meaning of Section 27A of the Securities Act of 1933, as amended, and Section 21E of the Securities Exchange Act of 1934, as amended. Forward-looking statements generally relate to future events or Gogoro’s future financial or operating performance. In some cases, you can identify forward-looking statements because they contain words such as “may,” “will,” “should,” “expects,” “plans,” “anticipates,” “going to,” “could,” “intends,” “target,” “projects,” “contemplates,” “believes,” “estimates,” “predicts,” “potential” or “continue” or the negative of these words or other similar terms or expressions that concern Gogoro’s expectations, strategy, priorities, plans or intentions. Forward-looking statements in this communication include, but are not limited to, statements in the section entitled, “Updated 2024 Guidance,” such as estimates regarding revenue and Gogoro’s revenue generated from the Taiwan market, and statements by Gogoro’s founder, chairman, and chief executive officer and Gogoro’s chief financial officer, such as projections of market opportunity and market share, the delivery of vehicles in the coming quarter, the revenue associated with the delivery of new vehicle models, partnership with potential and/or existing business partners and Gogoro’s business plans including its plans to grow and expand in Taiwan and internationally.
Gogoro’s expectations and beliefs regarding these matters may not materialize, and actual results in future periods are subject to risks and uncertainties that could cause actual results to differ materially from those projected, including risks related to macroeconomic factors including inflation and consumer confidence, risks related to the Taiwan scooter market, risks related to political tensions, Gogoro’s ability to effectively manage its growth, Gogoro’s ability to launch and ramp up the production of its products and control its manufacturing costs and manage its supply chain issues, Gogoro’s risks related to ability to expand its sales and marketing abilities, Gogoro’s ability to expand effectively into new markets, foreign exchange fluctuations, Gogoro’s ability to develop and maintain relationships with its partners, risks related to probable defects of Gogoro’s products and services and product recalls, regulatory risks and Gogoro’s risks related to strategic collaborations, risks related to the Taiwan market, India market, Philippines market and other international markets, alliances or joint ventures including Gogoro’s ability to enter into and execute its plans related to strategic collaborations, alliances or joint ventures in order for such strategic collaborations, alliances or joint ventures to be successful and generate revenue, the ability of Gogoro to be successful in the B2B market, risks related to Gogoro’s ability to achieve operational efficiencies, Gogoro’s ability to raise additional capital, the risks related to the need for Gogoro to invest more capital in strategic collaborations, alliances or joint ventures, risks relating to the impact of foreign exchange and the risk of Gogoro having to adjust the accounting treatment associated with its joint ventures. The forward-looking statements contained in this communication are also subject to other risks and uncertainties, including those more fully described in Gogoro’s filings with the Securities and Exchange Commission (“SEC”), including in Gogoro’s Form 20-F for the year ended December 31, 2023, which was filed on March 29, 2024 and in its subsequent filings with the SEC, copies of which are available on the SEC’s website at www.sec.gov. The forward-looking statements in this communication are based on information available to Gogoro as of the date hereof, and Gogoro disclaims any obligation to update any forward-looking statements, except as required by law.
Condensed Consolidated Financial Statements
The condensed consolidated financial statements are unaudited and have been prepared in accordance with the International Financial Reporting Standards (collectively, “IFRS”) issued by the International Accounting Standards Board and regulations of the U.S. Securities and Exchange Commission (“SEC”) for interim financial reporting. The Company’s condensed consolidated financial statements reflect all normal adjustments that are, in our opinion, necessary to provide a fair statement of results for the interim periods presented, including the accounts of the Company and entities controlled by Gogoro Inc. The audited consolidated financial statements may differ materially from the unaudited condensed consolidated financial statements. Our audited financial statements for the full year ended December 31, 2024 will be included in the Company’s Annual Report on Form 20-F for the year ended December 31, 2024. Accordingly, these condensed consolidated financial statements should be read in conjunction with the audited consolidated financial statements and related notes for the year ended December 31, 2023 included in the Company’s Annual Report on Form 20-F filed with the SEC on March 29, 2024, which provides a more complete discussion of the Company’s accounting policies and certain other information. The condensed consolidated financial statements may include selected updates, notes and disclosures if there are significant changes since the date of the most recent annual report on Form 20-F which included the audited financial statements of the Company.
Backlog Orders
Backlog orders are not recognized as revenue in our Condensed Consolidated Statements of Comprehensive Loss until we deliver a vehicle to the buyer. The backlog orders are recorded as contract liabilities and the portion associated with financing receivable would be net against account receivables in our Condensed Consolidated Balance Sheet. Backlog value is estimated based on manufacturer’s suggested retail price net off associated sales incentives.
Use of Non-IFRS Financial Measures
This press release and accompanying tables contain certain non-IFRS financial measures including foreign exchange effect on operating revenues, non-IFRS gross profit, non-IFRS gross margin, non-IFRS net loss, EBITDA and adjusted EBITDA.
Foreign exchange (“FX”) effect on operating revenues. We compare the dollar amount and the percent change in the operating revenues from the current period to the same period last year using constant currency disclosure. We present constant currency information to provide a framework for assessing how our underlying revenues performed excluding the effect of foreign currency rate fluctuations. To present this information, current period operating revenues for entities reporting in currencies other than USD are converted into USD at the average exchange rates from the equivalent periods last year.
Non-IFRS Gross Profit and Gross Margin. Gogoro defines non-IFRS gross profit and gross margin as gross profit and gross margin excluding share-based compensation, battery upgrade initiatives and battery swapping service rebate.
Share-based Compensation. Share-based compensation consists of non-cash charges related to the fair value of restricted stock units awarded to employees and stock options granted to certain directors, executives, employees and others providing similar services. We believe that the exclusion of these non-cash charges provides for more accurate comparisons of our operating results to our peer companies due to the varying available valuation methodologies, subjective assumptions and the variety of award types. In addition, we believe it is useful to investors to understand the specific impact of share-based compensation on our operating results.
Non-IFRS Net Loss. Gogoro defines non-IFRS net loss as net loss excluding share-based compensation, the change in fair value of financial liabilities including revaluation of change in fair value of earnout, earn-in and warrants associated with the merger of Poema, battery upgrade initiatives, and battery swapping service rebate. These amounts do not reflect the impact of any related tax effects.
EBITDA. Gogoro defines EBITDA as net loss excluding interest expense, net, provision for income tax, depreciation, and amortization. These amounts do not reflect the impact of any related tax effects.
Adjusted EBITDA. Gogoro defines Adjusted EBITDA as EBITDA excluding share-based compensation, the change in fair value of financial liabilities including revaluation of change in fair value of earnout, earn-in and warrants associated with the merger of Poema, battery upgrade initiatives, and battery swapping service rebate. These amounts do not reflect the impact of any related tax effects.
Battery Upgrade Initiatives. As we perform certain voluntary upgrades to our battery packs, this charge represents the (i) derecognition expense on components removed from the battery pack, which we do not expect to generate any future benefits from its disposal and (ii) battery pack retrieval and other costs. We will only upgrade battery packs in instances where the value created exceeds the cost of the upgrade. The program will improve batteries’ capacity and extend the remaining useful life of certain battery packs. The derecognition expense and the retrieval and other costs are recorded under Cost of Revenues in the Condensed Consolidated Statements of Comprehensive Loss. We exclude such expenditures for purposes of calculating certain non-IFRS measures because these charges do not reflect how management evaluates our operating performance. The adjustments facilitate a useful evaluation of our operating performance and comparisons to past operating results and provide investors with additional means to evaluate our profitability trends. We expect the derecognition expense and retrieval and other costs to recur in future periods as incurred during the implementation phase of the battery upgrade program.
Battery Swapping Service Rebate. We voluntarily offered one-time subscription fee discounts to certain subscribers of Gogoro Network who experienced unusual and infrequent service inconveniences associated with a minor voluntary vehicle recall and battery upgrade, and such battery swapping service rebates are recorded as contra-revenue. We have excluded the impacts of such rebates from our non-IFRS metrics to allow investors to better understand the underlying operation results of the business and to facilitate comparison of current financial results with historical financial results and our peer group companies’ financial results.
These non-IFRS financial measures exclude share-based compensation, interest expense, income tax, depreciation and amortization, change in fair value of financial liabilities associated with outstanding earnout shares, earn-in shares and warrants associated with the merger of Poema, battery upgrade initiative and battery swapping service rebate. The Company uses these non-IFRS financial measures internally in analyzing its financial results and believes that these non-IFRS financial measures are useful to investors as an additional tool to evaluate ongoing operating results and trends. In addition, these measures are the primary indicators management uses as a basis for its planning and forecasting for future periods.
Non-IFRS financial measures are not meant to be considered in isolation or as a substitute for comparable IFRS financial measures. Non-IFRS financial measures are subject to limitations and should be read only in conjunction with the Company’s consolidated financial statements prepared in accordance with IFRS. Non-IFRS financial measures do not have any standardized meaning and are therefore unlikely to be comparable to similarly titled measures presented by other companies. A description of these non-IFRS financial measures has been provided above and a reconciliation of the Company’s non-IFRS financial measures to their most directly comparable IFRS measures have been provided in the financial statement tables included in this press release, and investors are encouraged to review these reconciliations.
GOGORO INC.
Condensed Consolidated Balance Sheet
(unaudited)
(in thousands of U.S. dollars)
June 30,
December 31,
2024
2023
ASSETS
Current assets:
Cash and cash equivalents
$ 196,886
$ 173,885
Trade receivables
20,542
17,135
Inventories2
54,213
53,109
Other assets, current
22,243
22,009
Total current assets
293,884
266,138
Property, plant and equipment2
478,924
501,876
Investments accounted for using equity method
17,806
17,741
Right-of-use assets
28,266
30,412
Other assets, non-current
12,104
18,063
Total assets
$ 830,984
$ 834,230
LIABILITIES AND EQUITY
Current liabilities:
Borrowings, current
$ 84,026
$ 75,590
Financial liabilities at fair value through profit or loss
11,282
30,832
Notes and trade payables
35,814
38,117
Contract liabilities, current
19,397
11,606
Lease liabilities, current
9,978
11,296
Provisions, current
2,834
4,174
Other liabilities, current
37,488
42,439
Total current liabilities
200,819
214,054
Borrowings, non-current
307,961
334,581
Financial liabilities at amortized cost, non-current3
24,178
—
Lease liabilities, non-current
17,909
18,842
Provisions, non-current
1,739
2,332
Other liabilities, non-current
14,162
15,734
Total liabilities
566,768
585,543
Total equity
264,216
248,687
Total liabilities and equity
$ 830,984
$ 834,230
June 30,
December 31,
2024
2023
Inventories:
Raw materials
$ 32,383
$ 33,136
Semi-finished goods
3,329
3,559
Merchandise
18,501
16,414
Total inventories
$ 54,213
$ 53,109
GOGORO INC.
Condensed Consolidated Statements of Comprehensive Loss
(unaudited)
(in thousands of U.S. dollars, except net loss per share)
Three Months Ended June 30,
Six Months Ended June 30,
2024
2023
2024
2023
Operating revenues
$ 80,944
$ 87,247
$ 150,655
$ 166,566
Cost of revenues
76,772
73,947
142,010
143,005
Gross profit
4,172
13,300
8,645
23,561
Operating expenses:
Sales and marketing
11,687
11,534
22,268
23,377
General and administrative
8,573
11,298
17,942
22,397
Research and development
8,459
10,731
17,825
20,284
Other operating expenses
54
—
508
—
Total operating expenses
28,773
33,563
58,543
66,058
Loss from operations
(24,601)
(20,263)
(49,898)
(42,497)
Non-operating income (expenses):
Interest expense, net
(2,516)
(2,164)
(5,244)
(4,061)
Other income, net
1,313
1,304
3,729
3,400
Change in fair value of financial liabilities
6,352
15,603
19,550
(2,910)
Share of loss of investments accounted for
using equity method
(603)
(104)
(1,319)
(176)
Total non-operating income (expenses)
4,546
14,639
16,716
(3,747)
Net loss
(20,055)
(5,624)
(33,182)
(46,244)
Other comprehensive loss:
Exchange differences on translation
(2,707)
(5,605)
(11,026)
(3,433)
Total comprehensive loss
$ (22,762)
$ (11,229)
$ (44,208)
$ (49,677)
Basic and diluted net loss per share
$ (0.08)
$ (0.02)
$ (0.14)
$ (0.20)
Shares used in computing basic and diluted net
loss per share
246,535
231,951
241,238
232,506
Three Months Ended June 30,
Six Months Ended June 30,
Operating revenues:
2024
2023
2024
2023
Sales of hardware and others
$ 46,282
$ 53,908
$ 83,540
$ 100,964
Battery swapping service
34,662
33,339
67,115
65,602
Operating revenues
$ 80,944
$ 87,247
$ 150,655
$ 166,566
Three Months Ended June 30,
Six Months Ended June 30,
Share-based compensation:
2024
2023
2024
2023
Cost of revenues
$ 320
$ 655
$ 602
$ 1,265
Sales and marketing
505
1,004
954
1,846
General and administrative
2,136
3,397
3,809
6,174
Research and development
1,080
2,076
2,054
4,013
Total
$ 4,041
$ 7,132
$ 7,419
$ 13,298
GOGORO INC.
Condensed Consolidated Statements of Cash Flows
(unaudited)
(in thousands of U.S. dollars)
Six Months Ended June 30,
2024
2023
Cash flows from operating activities
Net loss
$ (33,182)
$ (46,244)
Adjustments for:
Depreciation and amortization
50,050
49,479
Expected credit loss
347
263
Share of loss of investments accounted for using equity method
1,319
176
Change in fair value of financial liabilities
(19,550)
2,910
Interest expense, net
5,244
4,061
Share-based compensation
7,419
13,298
Loss on disposal of property and equipment, net
501
2,119
Write-down of inventories
1,573
1,926
Provisions for product warranty
66
—
Changes in operating assets and liabilities:
Trade receivables
(3,754)
(6,332)
Inventories
(2,677)
(19,038)
Other current assets
5,266
3,168
Notes and trade payables
(2,303)
3,885
Contract liabilities
8,401
2,986
Other liabilities
(6,554)
(12,323)
Provisions for product warranty
(2,081)
(1,947)
Cash generated from (used in) operations
10,085
(1,613)
Interest expense and tax paid, net
(5,331)
(3,903)
Net cash generated from (used in) operating activities
4,754
(5,516)
Cash flows from investing activities
Payments for property, plant and equipment, net
(45,139)
(50,555)
Increase in refundable deposits
(442)
—
Payments for acquisitions of investments accounted for using equity
method
—
(16,351)
Payments of intangible assets, net
(62)
(80)
Increase in other financial assets
(286)
(135)
Net cash used in investing activities
(45,929)
(67,121)
Cash flows from financing activities
Proceeds from borrowings
33,826
35,148
Repayments of borrowings
(29,778)
(44,380)
Proceed from issuance of shares3
75,000
22
Guarantee deposits refund
(167)
(27)
Repayment of the principal portion of lease liabilities
(6,415)
(6,285)
Net cash generated from (used in) financing activities
72,466
(15,522)
Effect of exchange rate changes on cash and cash equivalents
(8,290)
(3,903)
Net increase (decrease) in cash and cash equivalents
23,001
(92,062)
Cash and cash equivalents at the beginning of the period
173,885
236,100
Cash and cash equivalents at the end of the period
$ 196,886
$ 144,038
GOGORO INC.
Condensed Consolidated Statements of Changes in Equity
(unaudited)
(in thousands of U.S. dollars)
Ordinary
Shares
Capital
Surplus
Accumulated
Deficits
Exchange
Difference on
Translation
Total Equity
Balance as of December 31, 2023
$ 24
$ 669,912
$ (425,978)
$ 4,729
$ 248,687
Net loss for the six months ended June 30, 2024
—
—
(33,182)
—
(33,182)
Other comprehensive loss for the six
months ended June 30, 2024
—
(11,026)
(11,026)
Changes in percentage of ownership interest
in investments accounted for using equity
method
—
1,496
—
—
1,496
Issuance of ordinary shares3
5
50,817
—
—
50,822
Shared-based compensation
—
7,419
—
—
7,419
Balance as of June 30, 2024
$ 29
$ 729,644
$ (459,160)
$ (6,297)
$ 264,216
GOGORO INC.
Reconciliation of IFRS Financial Metrics to Non-IFRS
(unaudited)
(in thousands of U.S. dollars)
Three Months Ended June 30,
2024
2023
IFRS
revenue YoY
change %
Revenue
excluding FX
effect YoY
change %
Operating revenues:
IFRS revenue
FX effect
Revenue
excluding FX
effect
IFRS revenue
Sales of hardware and
others
$ 46,282
$ 2,367
$ 48,649
$ 53,908
(14.1) %
(9.8) %
Battery swapping
service
34,662
1,848
36,510
33,339
4.0 %
9.5 %
Total
$ 80,944
$ 4,215
$ 85,159
$ 87,247
(7.2) %
(2.4) %
Six Months Ended June 30,
2024
2023
IFRS
revenue YoY
change %
Revenue
excluding FX
effect YoY
change %
Operating revenues:
IFRS revenue
FX effect
Revenue
excluding FX
effect
IFRS revenue
Sales of hardware and
others
$ 83,540
$ 3,651
$ 87,191
$ 100,964
(17.3) %
(13.6) %
Battery swapping
service
67,115
2,995
70,110
65,602
2.3 %
6.9 %
Total
$ 150,655
$ 6,646
$ 157,301
$ 166,566
(9.6) %
(5.6) %
Three Months Ended June 30,
Six Months Ended June 30,
2024
2023
2024
2023
Gross profit and gross margin
$ 4,172
5.2 %
$ 13,300
15.2 %
$ 8,645
5.7 %
$ 23,561
14.1 %
Share-based compensation
320
655
602
1,265
Battery upgrade initiatives
6,032
—
8,866
—
Battery swapping service rebate
—
—
1,661
—
Non-IFRS gross profit and gross margin
$ 10,524
13.0 %
$ 13,955
16.0 %
$ 19,774
13.1 %
$ 24,826
14.9 %
Three Months Ended June 30,
Six Months Ended June 30,
2024
2023
2024
2023
Net loss
$ (20,055)
$ (5,624)
$ (33,182)
$ (46,244)
Share-based compensation
4,041
7,132
7,419
13,298
Change in fair value of financial liabilities
(6,352)
(15,603)
(19,550)
2,910
Battery upgrade initiatives
6,032
—
8,866
—
Battery swapping service rebate
—
—
1,661
—
Non-IFRS net loss
$ (16,334)
$ (14,095)
$ (34,786)
$ (30,036)
Three Months Ended June 30,
Six Months Ended June 30,
2024
2023
2024
2023
Net loss
$ (20,055)
$ (5,624)
$ (33,182)
$ (46,244)
Interest expense, net
2,516
2,164
5,244
4,061
Depreciation and amortization
25,370
24,804
50,050
49,479
EBITDA
7,831
21,344
22,112
7,296
Share-based compensation
4,041
7,132
7,419
13,298
Change in fair value of financial liabilities
(6,352)
(15,603)
(19,550)
2,910
Battery upgrade initiatives
6,032
—
8,866
—
Battery swapping service rebate
—
—
1,661
—
Adjusted EBITDA
$ 11,552
$ 12,873
$ 20,508
$ 23,504
____________________
1
This is a non-IFRS measure, see Use of Non-IFRS Financial Measures for a description of the non-IFRS measures and Reconciliation of IFRS Financial Metrics to Non-IFRS for a reconciliation of the Company’s non-IFRS financial measures to their most directly comparable IFRS measures.
2
On June 30, 2024 and December 31, 2023, the company classified $25.4 million and $37.4 million, respectively of undeployed battery packs and related battery cells in property, plant and equipment based on the company’s deployment plan for the next 12 months.
3
Gogoro consummated two share subscription agreements with Gold Sino Assets Limited (“Gold Sino”) and Castrol Holdings International Limited (“Castrol”) on June 3 and June 25, 2024, respectively.
(i)
Pursuant to the agreement with Gold Sino, Gogoro issued 32,516,095 ordinary shares, at a price of $1.5377 per share, for an aggregated purchase price at $50,000,000, with warrants granted to Gold Sino to purchase, a portion or all, 10,838,698 ordinary shares of Gogoro in the successive five years immediately after the issuance. We classify such warrants as an equity instrument on our consolidated financial statements, as those warrants (i) do not contain a contractual obligation of Gogoro to deliver cash or another financial assets to another entity and (ii) are consistent with a fixed-for-fixed option pricing model. The warrants were not marked-to-market as the value of the warrants were initially valuated and recorded at $10.0 million in stockholders’ equity and remained classified within stockholders’ equity through their expiration.
(ii)
Pursuant to the agreement with Castrol, Gogoro issued 16,887,328 ordinary shares, at a price of $1.4804 per share, for an aggregated price at $25,000,000, with a put option, exercisable during the next 12 months after June 30, 2025, to require Gogoro to repurchase such ordinary shares, for a portion or all, at a price per share equal to that was purchased. We recorded such financial instrument as a financial liability at the present value of the repurchase amount at $24.2 million on the issuance date, which is reclassified from equity and will be subsequently measured at amortized cost by using the effective interest method.
View original content to download multimedia:https://www.prnewswire.com/news-releases/gogoro-releases-second-quarter-2024-financial-results-302223221.html
SOURCE Gogoro Inc.

You may like
Technology
The fire protection system market is projected to grow by USD 14.58 Billion from 2024-2028, with AI impacting trends and IoT-integrated smoke detectors boosting growth – Technavio
Published
51 seconds agoon
September 24, 2024By

NEW YORK, Sept. 24, 2024 /PRNewswire/ — Report on how AI is redefining market landscape – The Global Fire Protection System Market size is estimated to grow by USD 14.58 billion from 2024-2028, according to Technavio. The market is estimated to grow at a CAGR of 6.78% during the forecast period. Integration of smoke detectors with IOT and big data is driving market growth, with a trend towards growth in adoption of wireless technology in fire detection systems However, high installation and maintenance cost of fire protection systems poses a challenge – Key market players include ABB Ltd., API Group Corp., Carrier Global Corp., Eaton Corp. Plc, Encore Fire Protection, Fire Suppression Ltd., Fireline Corp., Firetrol Protection Systems Inc., Gentex Corp., Halma Plc, Hochiki America Corp., Honeywell International Inc., Johnson Controls International Plc., Minimax GmbH, Napco Security Technologies Inc., RTX Corp., Robert Bosch GmbH, Securitas AB, Securiton AG, and Siemens AG.
Key insights into market evolution with AI-powered analysis. Explore trends, segmentation, and growth drivers- View the snapshot of this report
Fire Protection System Market Scope
Report Coverage
Details
Base year
2023
Historic period
2018 – 2022
Forecast period
2024-2028
Growth momentum & CAGR
Accelerate at a CAGR of 6.78%
Market growth 2024-2028
USD 14582 million
Market structure
Fragmented
YoY growth 2022-2023 (%)
6.23
Regional analysis
North America, APAC, Europe, Middle East and Africa, and South America
Performing market contribution
APAC at 41%
Key countries
US, China, UK, Germany, and Japan
Key companies profiled
ABB Ltd., API Group Corp., Carrier Global Corp., Eaton Corp. Plc, Encore Fire Protection, Fire Suppression Ltd., Fireline Corp., Firetrol Protection Systems Inc., Gentex Corp., Halma Plc, Hochiki America Corp., Honeywell International Inc., Johnson Controls International Plc., Minimax GmbH, Napco Security Technologies Inc., RTX Corp., Robert Bosch GmbH, Securitas AB, Securiton AG, and Siemens AG
Market Driver
Wireless fire detection and alarm systems are essential solutions for modern enclosed structures, such as offices, hotels, monuments, halls, and warehouses. These systems consist of a radio gateway, radio fire detectors, and radio manual call points. Communication between devices occurs via a dual-band system with two frequency ranges (433 MHz and 868 MHz) and multiple channels, ensuring stable communication. Redundant transmission paths are available, enhancing reliability. Integration with traditional fire protection systems is possible, enabling the upgrading of existing systems. For instance, Johnson Controls, a leading provider of smart, healthy, and sustainable building solutions, has integrated body-worn cameras, autonomous robots, and package screening technology to expand its comprehensive building security portfolio.
The Fire Protection System market is thriving with trends such as ventilation systems and stairwell-pressurization systems ensuring better fire safety in buildings. Fire sprinkler contractors focus on energy efficiency and adhering to fire codes. Fire safety procedures and systems, including fire suppression, sprinklers, detection, response, and alarm systems, are essential. Wet-pipe, dry-pipe, pre-action, deluge, and water mist technology are key sprinkler types. Managed services, energy and power, oil & gas, and wireless alarm systems are also popular. Policies and regulations, retrofit infrastructure, and labor programs guide the industry. Construction equipment, facility management, building automation, and advanced technologies enhance fire safety. Response teams, fire control communicators, and sprinkler supervisory systems ensure effective fire management. Fire detection devices and materials are continually improving, with RFID systems and flame detectors leading the way.
Request Sample of our comprehensive report now to stay ahead in the AI-driven market evolution!
Market Challenges
Fire protection systems involve significant upfront investments due to the necessity of various components, including alarms, smoke detectors, and fire suppression systems. The installation costs are high because of the intricacy of networks and the requirement for advanced tools to respond effectively to fire situations. Vendors must continually upgrade their solutions and create new technologies, leading to increased procurement costs for businesses and government entities. Consequently, the high installation and maintenance expenses of fire protection systems may restrict market expansion during the forecast period.The Fire Protection System market faces several challenges in various sectors. In residential buildings, ensuring compliance with building codes for fire safety equipment like fire extinguishers and fire alarm equipment is crucial. Executive leadership and risk management prioritize safety concerns, especially with the Royal Assent and Fire Safety Order mandating responsible persons (RPs) to oversee fire safety. For installers, keeping up with regulatory updates is essential. In the Fire Analysis segment, real-time information from fire mapping and analysis systems, such as BakerRisk, helps identify potential risks. Economic advancements and construction activities necessitate retrofitting existing structures with sprinkler systems, water supply, water delivery, and distribution systems. Maintenance services for fire hose reels, hydrant systems, and suppression systems are vital to ensure optimal performance. Fire detection systems in hospitals and educational institutions require continuous monitoring to prevent supply chain disruptions. Wireless sensor networks and advanced fire suppression systems are key investments for improved fire safety norms. Carrier and other market leaders offer comprehensive fire protection solutions, including fire detection, suppression, and mapping systems.
Discover how AI is revolutionizing market trends- Get your access now!
Segment Overview
This fire protection system market report extensively covers market segmentation by
Product 1.1 Fire detection1.2 Fire suppression1.3 Fire response1.4 Fire analysisApplication 2.1 Commercial2.2 Industrial2.3 ResidentialGeography 3.1 North America3.2 APAC3.3 Europe3.4 Middle East and Africa3.5 South America
1.1 Fire detection- The fire detection product segment dominates the global fire protection system market due to the widespread use of fire detection systems in various industries and public places. These systems consist of essential components like smoke detectors, alarms, water sprinklers, and fire suppression equipment. They work together to detect and alert people through speakers and alarms upon sensing smoke, carbon monoxide, or fire. Regulatory bodies, such as the National Fire Protection Association and the Building Code of Australia, mandate the installation of these systems in public places like malls, hospitals, stadiums, and other gatherings, driving market growth.
Download a Sample of our comprehensive report today to discover how AI-driven innovations are reshaping competitive dynamics
Research Analysis
The Fire Protection System Market encompasses a range of technologies and services designed to prevent, detect, and suppress fires in various structures. Key drivers for this market include policies and regulations, labor programs, and the retrofitting of infrastructure with fire safety systems. Construction equipment and facility management companies play a crucial role in installing and maintaining these systems. Hospitals and educational institutions are significant end-users due to the high risk of fire and the need to protect people and assets. Fire alarm systems, fire suppression systems, fire hose reels, fire hydrant systems, automatic sprinkler systems, smoke management, ventilation systems, and stairwell-pressurization systems are essential components of fire protection systems. Fire safety procedures and energy efficiency are also critical considerations in the market. Wireless sensor networks and supply chain disruptions can impact the availability and cost of fire protection equipment. Fire sprinkler contractors provide essential services in the installation and maintenance of these systems. Overall, the Fire Protection System Market is a dynamic and growing industry that plays a vital role in ensuring the safety of people and assets in various sectors.
Market Research Overview
The Fire Protection System Market encompasses a range of technologies, materials, and services designed to prevent, detect, and suppress fires in various structures. Key market drivers include policies and regulations, such as the Federal Custodians and Tenants Fire Safety Act, Labor Programs, and Building Codes, which mandate the installation and maintenance of fire protection systems in residential and commercial buildings. Advanced technologies, like fire detection devices, building automation, and response teams, play a crucial role in enhancing fire safety. Retrofitting infrastructure, construction equipment, and facility management also contribute to the market’s growth. Economic advancements and construction activities create new opportunities for fire protection systems, particularly in sectors like hospitals, educational institutions, and high-rise residential buildings. Advanced technologies, such as fire analysis segment, real-time information systems, and wireless sensor networks, are transforming the market with their ability to provide early fire detection and efficient response. The market includes various types of fire protection systems, including sprinkler systems, suppression systems, and fire detection systems, as well as services like maintenance and installation. Executive leadership, risk management, and safety concerns are essential factors influencing market trends. Regulatory updates and fire safety norms continue to shape the market landscape, with key players focusing on energy efficiency, fire safety procedures, and fire codes.
Table of Contents:
1 Executive Summary
2 Market Landscape
3 Market Sizing
4 Historic Market Size
5 Five Forces Analysis
6 Market Segmentation
ProductFire DetectionFire SuppressionFire ResponseFire AnalysisApplicationCommercialIndustrialResidentialGeographyNorth AmericaAPACEuropeMiddle East And AfricaSouth America
7 Customer Landscape
8 Geographic Landscape
9 Drivers, Challenges, and Trends
10 Company Landscape
11 Company Analysis
12 Appendix
About Technavio
Technavio is a leading global technology research and advisory company. Their research and analysis focuses on emerging market trends and provides actionable insights to help businesses identify market opportunities and develop effective strategies to optimize their market positions.
With over 500 specialized analysts, Technavio’s report library consists of more than 17,000 reports and counting, covering 800 technologies, spanning across 50 countries. Their client base consists of enterprises of all sizes, including more than 100 Fortune 500 companies. This growing client base relies on Technavio’s comprehensive coverage, extensive research, and actionable market insights to identify opportunities in existing and potential markets and assess their competitive positions within changing market scenarios.
Contacts
Technavio Research
Jesse Maida
Media & Marketing Executive
US: +1 844 364 1100
UK: +44 203 893 3200
Email: media@technavio.com
Website: www.technavio.com/
View original content to download multimedia:https://www.prnewswire.com/news-releases/the-fire-protection-system-market-is-projected-to-grow-by-usd-14-58-billion-from-2024-2028–with-ai-impacting-trends-and-iot-integrated-smoke-detectors-boosting-growth—technavio-302256021.html
SOURCE Technavio
Technology
Blackbaud Showcases the Future of AI-Powered Fundraising and Financial Management for Social Impact Organizations at bbcon 2024
Published
53 seconds agoon
September 24, 2024By
Product Updates Build Connection Between Solutions and Teams While Delivering Contextual Intelligence—All to Help Social Impact Organizations Raise More, Save More and Work Smarter
CHARLESTON, S.C., Sept. 24, 2024 /PRNewswire/ — Blackbaud (NASDAQ: BLKB), the leading provider of software for powering social impact, today kicked off its annual technology conference, bbcon, announcing a wide range of innovation shaping the future of social impact technology.
“Our 40-plus years of expertise in this space and unwavering focus help us drive innovation that empowers our customers to achieve their missions,” said Mike Gianoni, president, CEO and vice chairman of the board of directors, Blackbaud. “We are transforming the way social impact organizations operate, giving back time and improving data-backed decision making. With cutting edge technology, thousands of customers—from nonprofits, to schools, foundations, companies and more—are amplifying their impact across communities and around the world. We’re proud to be the chosen partner of so many incredible organizations, and we’re committed to continue delivering for them.”
Innovation to Fuel Impact
Blackbaud unveiled a range of product updates and enhancements aimed at connecting workflows and teams to free up time and provide users the insight they need to deliver their best results, without guesswork.
The Future of Blackbaud Raiser’s Edge NXT®
Blackbaud shared its plans and progress for the next generation of its market-leading fundraising software, building on its commitment to roll out a reimagined user experience with all critical-end-to-end workflows and enhanced functionality in a single, unified view by the end of 2025. Key updates include:
A new navigation, making it easier and more intuitive for both fundraising and finance users to quickly find what they need among an expanded array of menu options.A common records engine for K-12 school fundraisers launching this year that will provide a complete picture of donors by connecting data across the entire school community.New donor recognition program management capabilities, coming in 2025, to automatically tie gifts to these programs for deeper donor engagement.
Intelligence for Good®: AI Built for Social Impact
Blackbaud is building AI that delivers fundraising performance, benchmarking and forecasting directly in-product, providing social impact professionals with insights connected to their business data and built on Blackbaud’s 40 years of sector leadership. Planned AI advancements include:
Blackbaud Copilot, an AI-powered coach and assistant that allows users to interact with their data in natural language, ask questions, and gain insights. Copilot is already embedded in Blackbaud Impact Edge™, and a technical preview in both Raiser’s Edge NXT and Financial Edge NXT® is planned for 2025 to help fundraisers understand, plan for and engage with high priority donors and prospects, and to help simplify fund accounting by combining automation and personalization.New performance insights to help organizations see how they stack up against others, based on Blackbaud’s rich benchmarking data.New tools for education customers, like an Award Cycle Manager within Blackbaud Award Management™ to give scholarship administrators a centralized view and KPIs, and an “at-risk” student tool for Blackbaud’s K-12 Education Management portfolio to help teachers identify students in need of extra support by consolidating data on attendance, test scores and work completion.
Accelerated Giving to Raise and Save More
Blackbaud continues to innovate across its integrated payments experiences to help organizations raise more and save more so that they can invest in their missions. Exciting updates include:
A wider global roll out of Blackbaud’s Optimized and Standard Donation Forms, proven to increase conversion rates, including the recent addition of the Intelligent Ask feature powered by Blackbaud AI, which ensures fundraisers target the right gift amount for each donor.Tap-to-pay capabilities that will allow supporters to tap their card on a mobile device to donate, pay entry fees or buy swag.The extension of Blackbaud’s Complete Cover offering—the social impact sector’s only solution with guaranteed 0% processing fees—to an initial set of partners, including Trellis for auctions and events and Almabase for higher education giving days.
Connected Financial Management
Blackbaud is connecting workflows throughout the finance office. The company will deliver 100% of core Financial Edge NXT capabilities in a unified view in Q1 of 2025, including new and improved Query and reconciliation functionality. Additional enhancements include:
Automated invoice scanning using Microsoft AI Document Intelligence to automate the entire payables process from start to finish directly in Financial Edge NXT.Payment Assistant for fully automated bill pay in Financial Edge NXT, helping customers to save hours a week with auto-reconciliation of payment assistant transactions, to reduce processing costs and to benefit from robust, built-in fraud protection.Deeper integration between Raiser’s Edge NXT and Financial Edge NXT to connect workflows from donation through disbursement with fewer manual steps, making it easier and faster to let donors know what their gifts paid for and when.Financial Edge NXT integration with Blackbaud Grantmaking™, connecting departments and surfacing the right financial data at the right time.
Extensibility and Flexibility
Blackbaud is combining the power of purpose-built software designed specifically for the business operations of social impact with platform-level flexibility to enable endless possibilities. The company is delivering more plug-and-play apps, system integrators and consulting services in the Blackbaud Marketplace, plus:
New partner integrations, including the connection of Blackbaud Education Management with UBIQ Education and BrightArrow, enabling K12 schools to power best-in-class school websites, connect their data, leverage marketing capabilities to drive enrollment, and give faculty access to mass communication functionality for all their classes, teams, advisories and more.The expansion of Red Arc’s existing integration for Raiser’s Edge NXT to Blackbaud CRM™ cloud-hosted customers, to directly connect their preferred digital marketing solutions, like Constant Contact, Mailchimp, HubSpot or Salesforce Marketing Cloud, to their CRM.New SKY Add-ins™ for both low-code and pro-code developers to create hyper-specific solutions and access partner solutions without ever leaving Blackbaud software. Six new Microsoft Power Platform-certified connectors offering more flexibility, plus added low-code tools for Blackbaud CRM that have already been popular in Raiser’s Edge NXT for embedding power automate workflows, power apps, adaptive cards and Power BI extensions.
Happening at bbcon 2024
bbcon 2024 is taking place this week in Seattle, welcoming thousands of social impact professionals for three days of unmatched networking, the latest in industry trends and inspiring keynotes. The agenda features a day-two keynote conversation with Emmy® award-winning actress and nonprofit founder Sheryl Lee Ralph, as well as a day-three appearance by Dr. Alex George, a bestselling author and podcaster focused on resilience and mental wellness. As the presenting sponsor, Microsoft will deliver several sessions on how nonprofits can use AI with their data to drive mission success around fundraising and campaign planning.
Mainstage sessions can be livestreamed for free through the bbcon virtual pass, with replay content available on demand beginning October 15. Visit bbconference.com for more information, and for more details on Blackbaud’s product roadmap, register to attend the Blackbaud Product Update Briefings, happening Nov. 12-14.
About Blackbaud
Blackbaud (NASDAQ: BLKB) is the leading software provider exclusively dedicated to powering social impact. Serving the nonprofit and education sectors, companies committed to social responsibility and individual change makers, Blackbaud’s essential software is built to accelerate impact in fundraising, nonprofit financial management, digital giving, grantmaking, corporate social responsibility and education management. With millions of users and over $100 billion raised, granted or managed through Blackbaud platforms every year, Blackbaud’s solutions are unleashing the potential of the people and organizations who change the world. Blackbaud has been named to Newsweek’s list of America’s Most Responsible Companies, Quartz’s list of Best Companies for Remote Workers, and Forbes’ list of America’s Best Employers. A remote-first company, Blackbaud has operations in the United States, Australia, Canada, Costa Rica and the United Kingdom, supporting users in 100+ countries. Learn more at www.blackbaud.com or follow us on X/Twitter, LinkedIn, Instagram and Facebook.
Media Inquiries
media@blackbaud.com
Forward-looking Statements
Except for historical information, all of the statements, expectations and assumptions contained in this news release are forward-looking statements that involve a number of risks and uncertainties, including statements regarding expected benefits of products and product features. Although Blackbaud attempts to be accurate in making these forward-looking statements, it is possible that future circumstances might differ from the assumptions on which such statements are based. In addition, other important factors that could cause results to differ materially include the following: general economic risks; uncertainty regarding increased business and renewals from existing customers; continued success in sales growth; management of integration of acquired companies and other risks associated with acquisitions; risks associated with successful implementation of multiple integrated software products; the ability to attract and retain key personnel; risks associated with management of growth; lengthy sales and implementation cycles; technological changes that make our products and services less competitive; and the other risk factors set forth from time to time in the SEC filings for Blackbaud, copies of which are available free of charge at the SEC’s website at www.sec.gov or upon request from Blackbaud’s investor relations department. All Blackbaud product names appearing herein are trademarks or registered trademarks of Blackbaud, Inc.
View original content to download multimedia:https://www.prnewswire.com/news-releases/blackbaud-showcases-the-future-of-ai-powered-fundraising-and-financial-management-for-social-impact-organizations-at-bbcon-2024-302256778.html
SOURCE Blackbaud
Technology
The event management as a service market is projected to grow by USD 576.5 Million from 2024-2028, with AI impacting trends and rising demand for online registration and payments – Technavio
Published
55 seconds agoon
September 24, 2024By
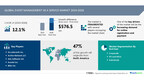
NEW YORK, Sept. 24, 2024 /PRNewswire/ — Report on how AI is redefining market landscape – The global event management as a service market size is estimated to grow by USD 576.5 million from 2024-2028, according to Technavio. The market is estimated to grow at a CAGR of over 12.1% during the forecast period. increasing demand for online registration and payment is driving market growth, with a trend towards emergence of ibeacons for event management However, threat from open-source event management software poses a challenge – Key market players include Accelevents Inc., Active Network LLC, Arlo Software Ltd., Aventri Inc., Bitrix Inc., Bizzabo, Certain Inc., Cvent Holding Corp., Event Temple Labs Inc., Eventbrite Inc., Fortive Corp., Glue Up, Hopin, New Work SE, RainFocus LLC, Ungerboeck, WebMobi, Whova Inc., XING Events GmbH, and Zoho Corp. Pvt. Ltd..
Key insights into market evolution with AI-powered analysis. Explore trends, segmentation, and growth drivers- View the snapshot of this report
Event Management As A Service Market Scope
Report Coverage
Details
Base year
2023
Historic period
–
Forecast period
2024-2028
Growth momentum & CAGR
Accelerate at a CAGR of 12.1%
Market growth 2024-2028
USD 576.5 million
Market structure
Fragmented
YoY growth 2022-2023 (%)
10.92
Regional analysis
North America, Europe, APAC, Middle East and Africa, and South America
Performing market contribution
North America at 47%
Key countries
US, China, UK, Canada, and Germany
Key companies profiled
Accelevents Inc., Active Network LLC, Arlo Software Ltd., Aventri Inc., Bitrix Inc., Bizzabo, Certain Inc., Cvent Holding Corp., Event Temple Labs Inc., Eventbrite Inc., Fortive Corp., Glue Up, Hopin, New Work SE, RainFocus LLC, Ungerboeck, WebMobi, Whova Inc., XING Events GmbH, and Zoho Corp. Pvt. Ltd.
Market Driver
The Event Management as a Service market refers to the outsourcing of event planning and execution to specialized companies. Businesses can benefit from this model by reducing costs, improving efficiency, and gaining access to expert resources. Event management companies offer a range of services, including venue selection, vendor coordination, logistics, and marketing. By partnering with a reputable event management firm, businesses can focus on their core competencies while ensuring the success of their events.
Event Management as a Service (EMaaS) is a growing trend in the business world, offering specialized tools and mobile applications to simplify event planning for event organizers. With the increasing complexity of events, productivity is key. EMaaS provides real-time interaction, email notifications, and feedback collection to ensure informed choices for future events. Blockchain technology adds security, while functionality adapts to cultural variations and communication hurdles. Small businesses on tight budgets benefit from automation of tasks, training staff, and internal communication. Personalized experiences and real-time feedback mechanisms enhance the overall experience for varied audiences. Cloud-based software offers low maintenance costs, virtual storage, and backup-restore facilities. Service delivery is seamless, and data-handling attributes ensure security. Assumptions are minimized through automated tasks and real-time interaction. Specialized tools cater to the needs of worldwide conferences, exhibits, and cultural events, making event management more efficient and effective.
Request Sample of our comprehensive report now to stay ahead in the AI-driven market evolution!
Market Challenges
The Event Management as a Service market refers to the outsourcing of event planning and execution to specialized companies. Businesses can leverage this model to save time and resources, focusing on their core operations. Service providers offer end-to-end solutions, from venue selection and vendor coordination to attendee management and post-event analysis. This market continues to grow as more companies recognize the benefits of partnering with experts to deliver successful events.The Event Management as a Service market faces several challenges. Purchasing tickets and interaction are key areas where seamless digital solutions are required. In the software segment, capabilities for financial management, conference scheduling, logistical management, vendor management, and monitoring of tasks are essential. Corporate spending and shifting customer preferences towards virtual events present challenges. Sustainability initiatives, regulatory compliance, and emerging markets require adaptability. Economic downturns, seasonality, security issues, environmental factors, event type, and client type add complexity. Event management software, digital tools, and cloud-based platforms offer solutions, including virtual exhibitor booths, chat functionality, live broadcasting, content distribution, and virtual event platforms. Regulatory restrictions and security issues necessitate robust solutions.
Discover how AI is revolutionizing market trends- Get your access now!
Segment Overview
This event management as a service market report extensively covers market segmentation by
End-user 1.1 Corporate1.2 PO and NGO1.3 IndividualsType 2.1 Pre-event services2.2 Onsite services2.3 Post-event servicesGeography 3.1 North America3.2 Europe3.3 APAC3.4 Middle East and Africa3.5 South America
1.1 Corporate- The Event Management as a Service market is experiencing significant growth due to the complete digitization of core event management processes and the adoption of customer-centricity. This segment caters to end-users such as private organizations, corporations, trading associations, educational institutions, and political parties. By outsourcing event management services, these organizations can effectively manage event logistics and enhance operational efficiency, resulting in cost savings of nearly 30%. Services include research, venue selection, hotel reservations, transportation arrangements, food and entertainment planning, site visits, and event execution. The corporate segment is particularly thriving in the UAE, where the government’s strong support for the MICE industry, as outlined in initiatives like Dubai Tourism Vision 2020 and Abu Dhabi Economic Vision 2030, fuels growth. Favorable policy adjustments, enhanced government funding, and robust infrastructure developments create an ideal environment for the expansion of event management enterprises in the UAE, contributing to the growth of the corporate segment of the global Event Management as a Service market.
Download a Sample of our comprehensive report today to discover how AI-driven innovations are reshaping competitive dynamics
Research Analysis
The Event Management as a Service (EMaaS) market is experiencing significant growth due to various factors. Corporate spending on events is on the rise, driven by the understanding that well-executed events can boost brand awareness and customer engagement. Shifting customer preferences towards virtual and hybrid events are also fueling the market’s growth. Sustainability initiatives and regulatory compliance are becoming increasingly important considerations in event planning. Emerging markets and regulatory restrictions present both opportunities and challenges. Economic downturns and seasonality can impact event attendance and budgets. Event management software, digital tools, cloud-based platforms, and mobile applications are transforming the industry, offering event managers specialized tools to streamline processes, increase productivity, and provide informed choices for event organizers. The complexity of events and the importance of delivering an overall excellent experience continue to be key drivers. Blockchain technology and data-handling attributes are gaining attention for their potential to enhance security and streamline event operations. Opinions and behavior of attendees continue to shape event strategies, with a focus on providing informed choices for future events.
Market Research Overview
The Event Management as a Service (EMaaS) market is experiencing significant growth due to corporate spending shifts, changing customer preferences, and sustainability initiatives. Regulatory compliance, economic downturns, seasonality, security issues, and environmental factors also impact the industry. EMaaS offers various tools such as event management software, digital tools, cloud-based platforms, mobile applications, and specialized tools to manage the complexity of events. Event strategies, productivity, and engagement are key considerations, with blockchain, functionality, and security being essential features. Small businesses with tight budgets benefit from EMaaS, while end-user organizations require real-time interaction, personalized experiences, and data-handling attributes. Assumptions about automation of tasks, email notifications, feedback collection, and training staff are important for effective event planning. Cultural variations and communication hurdles present challenges for planning varied audiences and cross-border activities. New features like gamification, AI-powered chatbots, and social media engagement enhance the overall experience for attendees.
Table of Contents:
1 Executive Summary
2 Market Landscape
3 Market Sizing
4 Historic Market Size
5 Five Forces Analysis
6 Market Segmentation
End-userCorporatePO And NGOIndividualsTypePre-event ServicesOnsite ServicesPost-event ServicesGeographyNorth AmericaEuropeAPACMiddle East And AfricaSouth America
7 Customer Landscape
8 Geographic Landscape
9 Drivers, Challenges, and Trends
10 Company Landscape
11 Company Analysis
12 Appendix
About Technavio
Technavio is a leading global technology research and advisory company. Their research and analysis focuses on emerging market trends and provides actionable insights to help businesses identify market opportunities and develop effective strategies to optimize their market positions.
With over 500 specialized analysts, Technavio’s report library consists of more than 17,000 reports and counting, covering 800 technologies, spanning across 50 countries. Their client base consists of enterprises of all sizes, including more than 100 Fortune 500 companies. This growing client base relies on Technavio’s comprehensive coverage, extensive research, and actionable market insights to identify opportunities in existing and potential markets and assess their competitive positions within changing market scenarios.
Contacts
Technavio Research
Jesse Maida
Media & Marketing Executive
US: +1 844 364 1100
UK: +44 203 893 3200
Email: media@technavio.com
Website: www.technavio.com/
View original content to download multimedia:https://www.prnewswire.com/news-releases/the-event-management-as-a-service-market-is-projected-to-grow-by-usd-576-5-million-from-2024-2028–with-ai-impacting-trends-and-rising-demand-for-online-registration-and-payments—technavio-302256076.html
SOURCE Technavio


The fire protection system market is projected to grow by USD 14.58 Billion from 2024-2028, with AI impacting trends and IoT-integrated smoke detectors boosting growth – Technavio
Blackbaud Showcases the Future of AI-Powered Fundraising and Financial Management for Social Impact Organizations at bbcon 2024

The event management as a service market is projected to grow by USD 576.5 Million from 2024-2028, with AI impacting trends and rising demand for online registration and payments – Technavio

Whiteboard Series with NEAR | Ep: 45 Joel Thorstensson from ceramic.network

Peloton Unveils Holiday 2022 Creative Campaign Highlighting How Motivation Transcends Beyond the Workout

These ’90s fashion trends are making a comeback in 2017

Why You Should Build on #NEAR – Co-founder Illia Polosukhin at CV Labs
Whiteboard Series with NEAR | Ep: 45 Joel Thorstensson from ceramic.network

NEAR End of Year Town Hall 2021: The Open Web World, MetaBUILD 2 Hackathon and 2021 recap
Trending
-

 Coin Market3 days ago
Indian Supreme Court recovers YouTube account from XRP scammers
-

 Coin Market5 days ago
Feds end Bitcoin bandits’ luxury life fueled by $230M crypto scam
-

 Technology3 days ago
Summit of Whose Future? Girls Have the Answers: Leaders Must Listen
-

 Near Videos3 days ago
Near AI Tech Showcase recap Singapore Token2049
-

 Near Videos1 day ago
Revolutionary Phase 2 of Nightshade 😲 – Stateless Validation Unleashed! 🚀
-
Technology4 days ago
Canada Announces Significant Funding to Unlock More Critical Minerals Development in Northern British Columbia and the Yukon
-

 Technology3 days ago
Huawei Launches All-New Xinghe Intelligent Campus with Full Upgrades, Maximizing Enterprises’ Intelligent Productivity
-

 Technology3 days ago
The Ar-King of Spirits: Ed Arking’s Impact on the Liquor Industry