
Technology
Docusign Announces Second Quarter Fiscal 2025 Financial Results
Published
4 months agoon
By
SAN FRANCISCO, Sept. 5, 2024 /PRNewswire/ — Docusign, Inc. (NASDAQ: DOCU) today announced results for its fiscal quarter ended July 31, 2024. Prepared remarks and the news release with the financial results will be accessible on Docusign’s website at investor.docusign.com prior to its webcast.
“Docusign continued its evolution with improved business stability and increased efficiency, resulting in record operating profit,” said Allan Thygesen, CEO of Docusign. “We’re proud that we began shipping our Intelligent Agreement Management platform this quarter and we are encouraged by the early results and customer feedback.”
Second Quarter Financial Highlights
Total revenue was $736.0 million, an increase of 7% year-over-year. Subscription revenue was $717.4 million, an increase of 7% year-over-year. Professional services and other revenue was $18.7 million, an increase of 2% year-over-year.Billings were $724.5 million, an increase of 2% year-over-year.GAAP gross margin was 78.9% compared to 78.8% in the same period last year. Non-GAAP gross margin was 82.2% compared to 82.3% in the same period last year.GAAP net income per basic share was $4.34 on 205 million shares outstanding compared to $0.04 on 204 million shares outstanding in the same period last year.GAAP net income per diluted share was $4.26 on 208 million shares outstanding compared to $0.04 on 208 million shares outstanding in the same period last year.Non-GAAP net income per diluted share was $0.97 on 208 million shares outstanding compared to $0.72 on 208 million shares outstanding in the same period last year.Net cash provided by operating activities was $220.2 million compared to $211.0 million in the same period last year.Free cash flow was $197.9 million compared to $183.6 million in the same period last year.Cash, cash equivalents, restricted cash and investments were $1.0 billion at the end of the quarter.Repurchases of common stock were $200.1 million compared to $30.0 million in the same period last year.
A reconciliation of GAAP to non-GAAP financial measures has been provided in the tables included in this press release. An explanation of these measures is also included below under the heading “Non-GAAP Financial Measures and Other Key Metrics.”
Operational and Other Financial Highlights:
Docusign Intelligent Agreement Management (“IAM”) General Availability: Docusign announced the beginning of general availability for IAM, a new category of AI-powered cloud software that helps streamline and automate agreement processes.
IAM Release 1 Availability: IAM applications, which include IAM Core, IAM for Sales, and IAM for CX, are now generally available in the U.S. IAM for CX went live for small and medium-sized commercial customers in North America and Australia. IAM will continue to rollout to enterprise and self-service customers across additional geographies throughout the fiscal year.
Executive Appointments: Docusign announced the following new leaders:
Paula Hansen joined Docusign as President and Chief Revenue Officer, leading enterprise and commercial sales and partnership teams worldwide. Most recently, Hansen served as President and Chief Revenue Officer at Alteryx, where she was responsible for leading the global go-to-market organization, which includes worldwide sales, sales engineering, partners, marketing, customer experience, customer support and revenue operations. Prior to Alteryx, she served in senior sales roles at SAP and Cisco.Sagnik Nandy joined Docusign as Chief Technology Officer, leading all aspects of engineering, research and engineering operations. Most recently, Nandy served as President and Chief Development Officer at Okta, where he led product, engineering and design for the Workforce Identity Cloud, which includes Okta’s core identity and access management platform. Prior to Okta, he served as VP of Engineering at Google.
Guidance
The company currently expects the following guidance:
Quarter ending October 31, 2024 (in millions, except percentages):
Total revenue
$743
to
$747
Subscription revenue
$722
to
$726
Billings
$710
to
$720
Non-GAAP gross margin
81.0 %
to
82.0 %
Non-GAAP operating margin
28.5 %
to
29.5 %
Non-GAAP diluted weighted-average shares outstanding
206
to
211
Fiscal Year ending January 31, 2025 (in millions, except percentages):
Total revenue
$2,940
to
$2,952
Subscription revenue
$2,864
to
$2,876
Billings
$2,990
to
$3,030
Non-GAAP gross margin
81.0 %
to
82.0 %
Non-GAAP operating margin
29.0 %
to
29.5 %
Non-GAAP diluted weighted-average shares outstanding
206
to
211
A reconciliation of non-GAAP guidance measures to corresponding GAAP guidance measures is not available on a forward-looking basis without unreasonable effort due to the uncertainty regarding, and the potential variability of, expenses that may be incurred in the future. Stock-based compensation-related charges, including employer payroll tax-related items on employee stock transactions, are impacted by many factors, including the timing of employee stock transactions, the future fair market value of our common stock, and our future hiring and retention needs, all of which are difficult to predict and subject to constant change. We have provided a reconciliation of GAAP to non-GAAP financial measures in the financial statement tables for our historical non-GAAP financial results included in this release.
Webcast Conference Call Information
The company will host a conference call on September 5, 2024 at 2:00 p.m. PT (5:00 p.m. ET) to discuss its financial results. A live webcast of the event will be available on the Docusign Investor Relations website at investor.docusign.com. Prepared remarks and the news release with the financial results will also be accessible on Docusign’s website prior to the webcast. A live dial-in will be available domestically at 877-407-0784 or internationally at 201-689-8560. A replay will be available domestically at 844-512-2921 or internationally at 412-317-6671 until midnight (EST) September 19, 2024 using the passcode 13748491.
About Docusign
Docusign brings agreements to life. Approximately 1.6 million customers and more than a billion people in over 180 countries use Docusign solutions to accelerate the process of doing business and simplify people’s lives. With intelligent agreement management, Docusign unleashes business critical data that is trapped inside of documents. Until now, these were disconnected from business systems of record, costing businesses time, money, and opportunity. Using Docusign IAM, companies can create, commit, and manage agreements with solutions created by the #1 company in e-signature and contract lifecycle management (CLM). Learn more at www.docusign.com.
Copyright 2024. Docusign, Inc. is the owner of DOCUSIGN® and all its other marks (www.docusign.com/IP).
Investor Relations:
Docusign Investor Relations
investors@docusign.com
Media Relations:
Docusign Corporate Communications
media@docusign.com
Forward-Looking Statements
This press release contains “forward-looking” statements within the meaning of Section 27A of the Securities Act of 1933, as amended, and Section 21E of the Securities Exchange Act of 1934, as amended, that are based on our management’s beliefs and assumptions and on information currently available to management, and which statements involve substantial risk and uncertainties. All statements contained in this press release other than statements of historical fact, including statements regarding our future operating results and financial position, our business strategy and plans, market growth and trends, objectives for future operations, and the impact of such assumptions on our financial condition and results of operations are forward-looking statements. Forward-looking statements in this press release also include, among other things, statements under “Guidance” above and any other statements about expected financial metrics, such as revenue, billings, non-GAAP gross margin, non-GAAP operating margin, non-GAAP diluted weighted-average shares outstanding, and non-financial metrics, as well as statements related to our expectations regarding the benefits and rollout of the Docusign IAM platform. Forward-looking statements generally relate to future events or our future financial or operating performance. In some cases, you can identify forward-looking statements because they contain words such as “may,” “will,” “should,” “expects,” “plans,” “anticipates,” “could,” “intends,” “target,” “projects,” “contemplates,” “believes,” “estimates,” “predicts,” “potential,” or “continue” or the negative of these words or other similar terms or expressions that concern our expectations, strategy, plans or intentions.
Forward-looking statements contained in this press release include, but are not limited to, statements about: our expectations regarding global macro-economic conditions, including the effects of inflation, volatile interest rates, and market volatility on the global economy; our ability to estimate the size and growth of our total addressable market; our ability to compete effectively in an evolving and competitive market; the impact of any data breaches, cyberattacks or other malicious activity on our technology systems; our ability to effectively sustain and manage our growth and future expenses and maintain or increase future profitability; our ability to attract new customers and maintain and expand our existing customer base; our ability to effectively implement and execute our restructuring plans; our ability to scale and update our platform to respond to customers’ needs and rapid technological change, including our ability to successfully incorporate generative artificial intelligence into our existing and future products; our ability to successfully execute our go-to-market and sales strategy for our IAM platform; our ability to expand use cases within existing customers and vertical solutions; our ability to expand our operations and increase adoption of our platform internationally; our ability to strengthen and foster our relationships with developers; our ability to retain our direct sales force, customer success team and strategic partnerships around the world; our ability to identify targets for and execute potential acquisitions and to successfully integrate and realize the anticipated benefits of such acquisitions; our ability to maintain, protect and enhance our brand; the sufficiency of our cash, cash equivalents and capital resources to satisfy our liquidity needs; limitations on us due to obligations we have under our credit facility or other indebtedness; our ability to realize the anticipated benefits of our stock repurchase program; our failure or the failure of our software to comply with applicable industry standards, laws and regulations; our ability to maintain, protect and enhance our intellectual property; our ability to successfully defend litigation against us; our ability to attract large organizations as users; our ability to maintain our corporate culture; our ability to offer high-quality customer support; our ability to hire, retain and motivate qualified personnel, including executive level management; our ability to successfully manage and integrate executive management transitions; uncertainties regarding the impact of general economic and market conditions, including as a result of regional and global conflicts; our ability to successfully implement and maintain new and existing information technology systems, including our ERP system; and our ability to maintain proper and effective internal controls.
Additional risks and uncertainties that could affect our financial results are included in the sections titled “Risk Factors” and “Management’s Discussion and Analysis of Financial Condition and Results of Operations” in our annual report on Form 10-K for the fiscal year ended January 31, 2024 filed on March 21, 2024, our quarterly report on Form 10-Q for the quarter ended July 31, 2024, which we expect to file on September 6, 2024 with the Securities and Exchange Commission (the “SEC”), and other filings that we make from time to time with the SEC. The forward-looking statements made in this press release relate only to events as of the date on which such statements are made. We undertake no obligation to update any forward-looking statements after the date of this press release or to conform such statements to actual results or revised expectations, except as required by law.
Non-GAAP Financial Measures and Other Key Metrics
To supplement our consolidated financial statements, which are prepared and presented in accordance with GAAP, we use certain non-GAAP financial measures, as described below, to understand and evaluate our core operating performance. These non-GAAP financial measures, which may be different than similarly-titled measures used by other companies, are presented to enhance investors’ overall understanding of our financial performance and should not be considered a substitute for, or superior to, the financial information prepared and presented in accordance with GAAP.
We believe that these non-GAAP financial measures provide useful information about our financial performance, enhance the overall understanding of our past performance and future prospects, and allow for greater transparency with respect to important metrics used by our management for financial and operational decision-making. We present these non-GAAP measures to assist investors in seeing our financial performance using a management view, and because we believe that these measures provide an additional tool for investors to use in comparing our core financial performance over multiple periods with other companies in our industry. However, these non-GAAP measures are not intended to be considered in isolation from, a substitute for, or superior to our GAAP results.
Non-GAAP gross profit, non-GAAP gross margin, non-GAAP operating expenses, non-GAAP income from operations, non-GAAP operating margin, non-GAAP net income and non-GAAP net income per share: We define these non-GAAP financial measures as the respective GAAP measures, excluding expenses related to stock-based compensation, employer payroll tax on employee stock transactions, amortization of acquisition-related intangibles, amortization of debt discount and issuance costs, fair value adjustments to strategic investments, acquisition-related expenses, lease-related impairment and lease-related charges, restructuring and other related charges, as these costs are not reflective of ongoing operations and, as applicable, other special items. The amount of employer payroll tax-related items on employee stock transactions is dependent on our stock price and other factors that are beyond our control and do not correlate to the operation of the business. When evaluating the performance of our business and making operating plans, we do not consider these items (for example, when considering the impact of equity award grants, we place a greater emphasis on overall stockholder dilution rather than the accounting charges associated with such grants). We believe it is useful to exclude these expenses in order to better understand the long-term performance of our core business and to facilitate comparison of our results to those of peer companies and over multiple periods. In addition to these exclusions, we subtract an assumed provision for income taxes to calculate non-GAAP net income. We utilize a fixed long-term projected tax rate in our computation of the non-GAAP income tax provision to provide better consistency across the reporting periods. For fiscal 2024 and fiscal 2025, we have determined the projected non-GAAP tax rate to be 20%.
Free cash flow: We define free cash flow as net cash provided by operating activities less purchases of property and equipment. We believe free cash flow is an important liquidity measure of the cash that is available (if any), after purchases of property and equipment, for operational expenses, investment in our business, and to make acquisitions. Free cash flow is useful to investors as a liquidity measure because it measures our ability to generate or use cash in excess of our capital investments in property and equipment. Once our business needs and obligations are met, cash can be used to maintain a strong balance sheet and invest in future growth.
Billings: We define billings as total revenues plus the change in our contract liabilities and refund liability less contract assets and unbilled accounts receivable in a given period. Billings reflects sales to new customers plus subscription renewals and additional sales to existing customers. Only amounts invoiced to a customer in a given period are included in billings. We believe billings can be used to measure our periodic performance, when taking into consideration the timing aspects of customer renewals, which represents a large component of our business. Given that most of our customers pay in annual installments one year in advance, but we typically recognize a majority of the related revenue ratably over time, we use billings to measure and monitor our ability to provide our business with the working capital generated by upfront payments from our customers.
For a reconciliation of these non-GAAP financial measures to the most directly comparable GAAP financial measure, please see “Reconciliation of GAAP to Non-GAAP Financial Measures” below.
DOCUSIGN, INC.
CONDENSED CONSOLIDATED STATEMENTS OF OPERATIONS
(Unaudited)
Three Months Ended
July 31,
Six Months Ended
July 31,
(in thousands, except per share data)
2024
2023
2024
2023
Revenue:
Subscription
$ 717,366
$ 669,367
$ 1,408,849
$ 1,308,674
Professional services and other
18,661
18,320
36,818
40,401
Total revenue
736,027
687,687
1,445,667
1,349,075
Cost of revenue:
Subscription
132,372
116,185
258,974
225,127
Professional services and other
23,093
29,397
45,937
56,942
Total cost of revenue
155,465
145,582
304,911
282,069
Gross profit
580,562
542,105
1,140,756
1,067,006
Operating expenses:
Sales and marketing
287,464
294,838
569,108
575,443
Research and development
147,571
135,960
281,891
251,324
General and administrative
87,129
103,884
179,607
208,695
Restructuring and other related charges
597
811
29,721
29,583
Total operating expenses
522,761
535,493
1,060,327
1,065,045
Income from operations
57,801
6,612
80,429
1,961
Interest expense
(544)
(1,592)
(688)
(3,558)
Interest income and other income, net
14,630
17,455
28,739
29,700
Income before provision for (benefit from) income taxes
71,887
22,475
108,480
28,103
Provision for (benefit from) income taxes
(816,324)
15,080
(813,491)
20,169
Net income
$ 888,211
$ 7,395
$ 921,971
$ 7,934
Net income per share attributable to common stockholders:
Basic
$ 4.34
$ 0.04
$ 4.49
$0.04
Diluted
$ 4.26
$ 0.04
$ 4.40
$0.04
Weighted-average shares used in computing net income per share:
Basic
204,604
203,703
205,231
203,177
Diluted
208,274
208,192
209,559
208,284
Stock-based compensation expense included in costs and expenses:
Cost of revenue—subscription
$ 15,593
$ 13,081
$ 29,774
$ 24,438
Cost of revenue—professional services and other
4,998
7,286
9,700
14,016
Sales and marketing
58,778
51,563
105,049
96,889
Research and development
53,430
45,151
97,632
81,148
General and administrative
31,649
34,592
60,169
74,934
Restructuring and other related charges
208
34
4,836
4,988
DOCUSIGN, INC.
CONDENSED CONSOLIDATED BALANCE SHEETS
(Unaudited)
(in thousands)
July 31, 2024
January 31, 2024
Assets
Current assets
Cash and cash equivalents
$ 619,064
$ 797,060
Investments—current
319,289
248,402
Accounts receivable, net
309,885
439,299
Contract assets—current
13,449
15,922
Prepaid expenses and other current assets
81,693
66,984
Total current assets
1,343,380
1,567,667
Investments—noncurrent
102,537
121,977
Property and equipment, net
265,544
245,173
Operating lease right-of-use assets
117,877
123,188
Goodwill
455,519
353,138
Intangible assets, net
90,227
50,905
Deferred contract acquisition costs—noncurrent
427,599
409,627
Deferred tax assets—noncurrent
822,026
2,031
Other assets—noncurrent
129,232
97,584
Total assets
$ 3,753,941
$ 2,971,290
Liabilities and Equity
Current liabilities
Accounts payable
$ 8,116
$ 19,029
Accrued expenses and other current liabilities
93,251
104,037
Accrued compensation
178,603
195,266
Contract liabilities—current
1,307,565
1,320,059
Operating lease liabilities—current
19,769
22,230
Total current liabilities
1,607,304
1,660,621
Contract liabilities—noncurrent
23,020
21,980
Operating lease liabilities—noncurrent
115,832
120,823
Deferred tax liability—noncurrent
18,122
16,795
Other liabilities—noncurrent
28,257
21,332
Total liabilities
1,792,535
1,841,551
Stockholders’ equity
Common stock
20
21
Treasury stock
(2,670)
(2,164)
Additional paid-in capital
3,087,650
2,821,461
Accumulated other comprehensive loss
(24,548)
(19,360)
Accumulated deficit
(1,099,046)
(1,670,219)
Total stockholders’ equity
1,961,406
1,129,739
Total liabilities and equity
$ 3,753,941
$ 2,971,290
DOCUSIGN, INC.
CONDENSED CONSOLIDATED STATEMENTS OF CASH FLOWS
(Unaudited)
Three Months Ended
July 31,
Six Months Ended
July 31,
(in thousands)
2024
2023
2024
2023
Cash flows from operating activities:
Net income
$ 888,211
$ 7,395
$ 921,971
$ 7,934
Adjustments to reconcile net income to net cash provided by operating activities:
Depreciation and amortization
27,022
25,238
51,528
48,105
Amortization of deferred contract acquisition and fulfillment costs
57,255
50,152
111,467
98,382
Amortization of debt discount and transaction costs
139
1,249
277
2,495
Non-cash operating lease costs
4,984
5,751
9,862
11,731
Stock-based compensation expense
164,656
151,707
307,160
296,413
Deferred income taxes
(826,038)
1,797
(824,561)
3,420
Other
3,851
49
5,323
(782)
Changes in operating assets and liabilities:
Accounts receivable
(7,068)
(8,478)
123,571
99,803
Prepaid expenses and other current assets
(6)
2,383
(17,067)
(14,420)
Deferred contract acquisition and fulfillment costs
(68,183)
(56,830)
(131,255)
(113,356)
Other assets
(16,975)
(772)
(15,058)
(8,433)
Accounts payable
(10,412)
(11,273)
(11,575)
(20,294)
Accrued expenses and other liabilities
(4,680)
9,069
(8,160)
10,164
Accrued compensation
25,146
18,270
(19,902)
(3,312)
Contract liabilities
(11,553)
22,171
(16,526)
40,458
Operating lease liabilities
(6,141)
(6,862)
(12,021)
(13,657)
Net cash provided by operating activities
220,208
211,016
475,034
444,651
Cash flows from investing activities:
Cash paid for acquisition, net of acquired cash
(143,611)
—
(143,611)
—
Purchases of marketable securities
(103,603)
(120,542)
(223,241)
(174,372)
Maturities of marketable securities
93,509
83,318
175,623
164,017
Purchases of strategic and other investments
(125)
(120)
(625)
(120)
Purchases of property and equipment
(22,280)
(27,379)
(45,033)
(46,436)
Net cash used in investing activities
(176,110)
(64,723)
(236,887)
(56,911)
Cash flows from financing activities:
Repurchases of common stock
(200,076)
(30,008)
(349,138)
(70,480)
Settlement of capped calls, net of related costs
—
—
—
23,688
Payment of tax withholding obligation on net RSU settlement and ESPP purchase
(39,446)
(40,044)
(81,083)
(62,681)
Proceeds from exercise of stock options
454
705
1,089
832
Proceeds from employee stock purchase plan
—
—
20,190
18,390
Net cash used in financing activities
(239,068)
(69,347)
(408,942)
(90,251)
Effect of foreign exchange on cash, cash equivalents and restricted cash
238
1,279
(2,677)
2,290
Net increase (decrease) in cash, cash equivalents and restricted cash
(194,732)
78,225
(173,472)
299,779
Cash, cash equivalents and restricted cash at beginning of period (1)
822,759
944,755
801,499
723,201
Cash, cash equivalents and restricted cash at end of period (1)
$ 628,027
$ 1,022,980
$ 628,027
$ 1,022,980
(1) Cash, cash equivalents and restricted cash included restricted cash of $9.0 million and $4.4 million at July 31, 2024 and January 31, 2024.
DOCUSIGN, INC.
RECONCILIATION OF GAAP TO NON-GAAP FINANCIAL MEASURES
(Unaudited)
Reconciliation of gross profit (loss) and gross margin:
Three Months Ended
July 31,
Six Months Ended
July 31,
(in thousands)
2024
2023
2024
2023
GAAP gross profit
$ 580,562
$ 542,105
$ 1,140,756
$ 1,067,006
Add: Stock-based compensation
20,591
20,367
39,474
38,454
Add: Amortization of acquisition-related intangibles
3,067
2,314
5,137
4,717
Add: Employer payroll tax on employee stock transactions
816
713
1,839
1,387
Add: Lease-related impairment and lease-related charges
—
292
—
721
Non-GAAP gross profit
$ 605,036
$ 565,791
$ 1,187,206
$ 1,112,285
GAAP gross margin
78.9 %
78.8 %
78.9 %
79.1 %
Non-GAAP adjustments
3.3 %
3.5 %
3.1 %
3.3 %
Non-GAAP gross margin
82.2 %
82.3 %
82.0 %
82.4 %
GAAP subscription gross profit
$ 584,994
$ 553,182
$ 1,149,875
$ 1,083,547
Add: Stock-based compensation
15,593
13,081
29,774
24,438
Add: Amortization of acquisition-related intangibles
3,067
2,314
5,137
4,717
Add: Employer payroll tax on employee stock transactions
595
465
1,387
930
Add: Lease-related impairment and lease-related charges
—
206
—
505
Non-GAAP subscription gross profit
$ 604,249
$ 569,248
$ 1,186,173
$ 1,114,137
GAAP subscription gross margin
81.5 %
82.6 %
81.6 %
82.8 %
Non-GAAP adjustments
2.7 %
2.4 %
2.6 %
2.3 %
Non-GAAP subscription gross margin
84.2 %
85.0 %
84.2 %
85.1 %
GAAP professional services and other gross loss
$ (4,432)
$ (11,077)
$ (9,119)
$ (16,541)
Add: Stock-based compensation
4,998
7,286
9,700
14,016
Add: Employer payroll tax on employee stock transactions
221
248
452
457
Add: Lease-related impairment and lease-related charges
—
86
—
216
Non-GAAP professional services and other gross profit
$ 787
$ (3,457)
$ 1,033
$ (1,852)
GAAP professional services and other gross margin
(23.8) %
(60.4) %
(24.8) %
(40.9) %
Non-GAAP adjustments
28.0 %
41.5 %
27.6 %
36.3 %
Non-GAAP professional services and other gross margin
4.2 %
(18.9) %
2.8 %
(4.6) %
Reconciliation of operating expenses:
Three Months Ended
July 31,
Six Months Ended
July 31,
(in thousands)
2024
2023
2024
2023
GAAP sales and marketing
$ 287,464
$ 294,838
$ 569,108
$ 575,443
Less: Stock-based compensation
(58,778)
(51,563)
(105,049)
(96,889)
Less: Amortization of acquisition-related intangibles
(3,113)
(2,630)
(5,742)
(5,259)
Less: Employer payroll tax on employee stock transactions
(1,595)
(1,400)
(3,733)
(3,070)
Less: Lease-related impairment and lease-related charges
—
(815)
—
(2,171)
Non-GAAP sales and marketing
$ 223,978
$ 238,430
$ 454,584
$ 468,054
GAAP sales and marketing as a percentage of revenue
39.1 %
42.9 %
39.4 %
42.7 %
Non-GAAP sales and marketing as a percentage of revenue
30.4 %
34.7 %
31.4 %
34.7 %
GAAP research and development
$ 147,571
$ 135,960
$ 281,891
$ 251,324
Less: Stock-based compensation
(53,430)
(45,151)
(97,632)
(81,148)
Less: Employer payroll tax on employee stock transactions
(1,754)
(1,387)
(4,319)
(2,795)
Less: Lease-related impairment and lease-related charges
—
(381)
—
(873)
Non-GAAP research and development
$ 92,387
$ 89,041
$ 179,940
$ 166,508
GAAP research and development as a percentage of revenue
20.0 %
19.8 %
19.5 %
18.6 %
Non-GAAP research and development as a percentage of revenue
12.6 %
12.9 %
12.4 %
12.3 %
GAAP general and administrative
$ 87,129
$ 103,884
$ 179,607
$ 208,695
Less: Stock-based compensation
(31,649)
(34,592)
(60,169)
(74,934)
Less: Employer payroll tax on employee stock transactions
(607)
(546)
(1,285)
(978)
Less: Acquisition-related expenses
(3,358)
—
(4,716)
—
Less: Lease-related impairment and lease-related charges
—
(296)
—
(695)
Non-GAAP general and administrative
$ 51,515
$ 68,450
$ 113,437
$ 132,088
GAAP general and administrative as a percentage of revenue
11.8 %
15.1 %
12.4 %
15.4 %
Non-GAAP general and administrative as a percentage of revenue
7.0 %
10.0 %
7.8 %
9.8 %
Reconciliation of income from operations and operating margin:
Three Months Ended
July 31,
Six Months Ended
July 31,
(in thousands)
2024
2023
2024
2023
GAAP income from operations
$ 57,801
$ 6,612
$ 80,429
$ 1,961
Add: Stock-based compensation
164,448
151,673
302,324
291,425
Add: Amortization of acquisition-related intangibles
6,180
4,944
10,879
9,976
Add: Employer payroll tax on employee stock transactions
4,772
4,046
11,176
8,230
Add: Acquisition-related expenses
3,358
—
4,716
—
Add: Restructuring and other related charges
597
811
29,721
29,583
Add: Lease-related impairment and lease-related charges
—
1,784
—
4,460
Non-GAAP income from operations
$ 237,156
$ 169,870
$ 439,245
$ 345,635
GAAP operating margin
7.9 %
1.0 %
5.6 %
0.1 %
Non-GAAP adjustments
24.3 %
23.7 %
24.8 %
25.5 %
Non-GAAP operating margin
32.2 %
24.7 %
30.4 %
25.6 %
Reconciliation of net income and net income per share, basic and diluted:
Three Months Ended
July 31,
Six Months Ended
July 31,
(in thousands, except per share data)
2024
2023
2024
2023
GAAP net income
$ 888,211
$ 7,395
$ 921,971
$ 7,934
Add: Stock-based compensation
164,448
151,673
302,324
291,425
Add: Amortization of acquisition-related intangibles
6,180
4,944
10,879
9,976
Add: Employer payroll tax on employee stock transactions
4,772
4,046
11,176
8,230
Add: Acquisition-related expenses
3,358
—
4,716
—
Add: Restructuring and other related charges
597
811
29,721
29,583
Add: Amortization of debt discount and issuance costs
—
1,294
—
2,898
Add: Fair value adjustments to strategic investments
—
—
—
119
Add: Lease-related impairment and lease-related charges
—
1,784
—
4,460
Add: Income tax and other tax adjustments
(866,572)
(22,325)
(906,950)
(54,790)
Non-GAAP net income
$ 200,994
$ 149,622
$ 373,837
$ 299,835
Numerator:
Non-GAAP net income
$ 200,994
$ 149,622
$ 373,837
$ 299,835
Add: Interest expense on convertible senior notes
—
46
—
403
Non-GAAP net income attributable to common stockholders, diluted
$ 200,994
$ 149,668
$ 373,837
$ 300,238
Denominator:
Weighted-average common shares outstanding, basic
204,604
203,703
205,231
203,177
Effect of dilutive securities
3,670
4,489
4,328
5,107
Non-GAAP weighted-average common shares outstanding, diluted
208,274
208,192
209,559
208,284
GAAP net income per share, basic
$ 4.34
$ 0.04
$ 4.49
$ 0.04
GAAP net income per share, diluted
$ 4.26
$ 0.04
$ 4.40
$ 0.04
Non-GAAP net income per share, basic
$ 0.98
$ 0.73
$ 1.82
$ 1.48
Non-GAAP net income per share, diluted
$ 0.97
$ 0.72
$ 1.78
$ 1.44
Computation of free cash flow:
Three Months Ended
July 31,
Six Months Ended
July 31,
(in thousands)
2024
2023
2024
2023
Net cash provided by operating activities
$ 220,208
$ 211,016
$ 475,034
$ 444,651
Less: Purchases of property and equipment
(22,280)
(27,379)
(45,033)
(46,436)
Non-GAAP free cash flow
$ 197,928
$ 183,637
$ 430,001
$ 398,215
Net cash used in investing activities
$ (176,110)
$ (64,723)
$ (236,887)
$ (56,911)
Net cash used in financing activities
$ (239,068)
$ (69,347)
$ (408,942)
$ (90,251)
Computation of billings:
Three Months Ended
July 31,
Six Months Ended
July 31,
(in thousands)
2024
2023
2024
2023
Revenue
$ 736,027
$ 687,687
$ 1,445,667
$ 1,349,075
Add: Contract liabilities and refund liability, end of period
1,334,461
1,233,894
1,334,461
1,233,894
Less: Contract liabilities and refund liability, beginning of period
(1,340,680)
(1,210,965)
(1,343,792)
(1,191,269)
Add: Contract assets and unbilled accounts receivable, beginning of period
17,179
22,936
20,189
16,615
Less: Contract assets and unbilled accounts receivable, end of period
(17,461)
(22,358)
(17,461)
(22,358)
Add: Contract assets and unbilled accounts receivable by acquisitions
53
—
53
—
Less: Contract liabilities and refund liability contributed by acquisitions
(5,071)
—
(5,071)
—
Non-GAAP billings
$ 724,508
$ 711,194
$ 1,434,046
$ 1,385,957
View original content:https://www.prnewswire.com/news-releases/docusign-announces-second-quarter-fiscal-2025-financial-results-302238864.html
SOURCE DocuSign, Inc.

You may like
Technology
LG Electronics and Samsung Unveil Cutting Edge Shoppable TV Capabilities Powered by TheTake.AI at CES 2025
Published
27 minutes agoon
January 7, 2025By
LAS VEGAS, Jan. 7, 2025 /PRNewswire/ — TheTake, the leader in AI-powered shoppable TV technology, today announced groundbreaking partnerships with LG Electronics and Samsung Electronics at the 2025 Consumer Electronics Show (CES) in Las Vegas. These collaborations significantly expand TheTake’s reach and capabilities, further solidifying its position as the premier platform for interactive, shoppable television experiences.
Building on TheTake’s impressive multiplatform footprint of 32 million devices and exceptional user engagement achieved in 2024, these partnerships represent a major leap forward for the Shoppable TV space.
LG Electronics Integrates ‘Click to Search’ Functionality
LG Electronics showcased an innovative ‘Click to Search’ feature powered by TheTake’s cutting-edge real-time AI shopping technology. The functionality enables LG viewers to instantly search for and identify virtually any person or product on screen by simply clicking on them with their LG Magic Remote. Viewers can then shop all their favorite products through a seamless and secure purchase flow, completing transactions effortlessly with LG’s webOS Pay functionality.
“Our partnership with LG Electronics is a testament to the power of AI in transforming how viewers engage with content on television,” said Tyler Cooper, CEO of TheTake. “By integrating our real-time shopping technology with LG’s innovative Magic Remote, we’re making it easier than ever for viewers to bring the products they love into their lives.”
Samsung Electronics Introduces Revolutionary Shoppable TV Features
Samsung Electronics, in partnership with TheTake, unveiled a suite of groundbreaking shoppable TV experiences.
Trending TV Shopping – Viewers can browse and shop for trending products appearing in today’s top linear and streaming programming directly through their Samsung TVs.Enhanced Shopping via Daily+ and Daily Board Interfaces – Samsung’s unique interfaces allow for highly engaging experiences, providing brands with unparalleled opportunities to reach high intent audiences in a premium CTV environment.
“Our partnership with Samsung Electronics represents a huge step forward for TheTake,” said Tyler Cooper, CEO of TheTake. “By leveraging Samsung’s innovative interfaces, we’re able to deliver high intent, engaging shopping experiences to consumers and brands alike.”
Driving Innovation and Market Leadership
Together, LG and Samsung account for a combined 59% of the U.S. smart TV market share, positioning TheTake as the leader in the fast-evolving Shoppable TV space. These collaborations follow TheTake’s 2024 partnership announcements with global sports streaming giant DAZN and emerging smart TV OEM Telly.
About TheTake
TheTake’s AI-powered technology is redefining how consumers interact with television by transforming passive viewing into an engaging, shoppable experience. With these new partnerships, TheTake continues to innovate and lead the charge in making TV content actionable for viewers and brands.
For More Information
Contact: info@thetake.com
Visit: [www.thetake.ai](http://www.thetake.ai)
Press Contacts:
TheTake Public Relations Team
press@thetake.com
View original content to download multimedia:https://www.prnewswire.com/news-releases/lg-electronics-and-samsung-unveil-cutting-edge-shoppable-tv-capabilities-powered-by-thetakeai-at-ces-2025-302344888.html
SOURCE TheTake
Technology
Reolink Debuts 16MP Wi-Fi Camera & Continuous Recording Battery Cam Series at CES 2025
Published
27 minutes agoon
January 7, 2025By

LAS VEGAS, Jan. 7, 2025 /PRNewswire/ — Reolink, an innovative leader in intelligent visual technology for the home, today launches the Duo 3 WiFi at CES 2025. It is a 16MP UHD plug-in Wi-Fi camera with expansive 180° panoramic view, a new addition to Reolink’s groundbreaking 16MP series. Reolink also announces to release a new product line-up, the Altas Series – a range of battery-powered cameras designed for 24/7 continuous recording on a single charge. These new products underscore the company’s commitment to driving home security forward and enhancing daily life with user-centric innovation.
Reolink Duo 3 WiFi: 16MP Crystal-Clear Details and 180° Coverage
Struggling with blurry details, blind spots, or slow streaming? Reolink Duo 3 WiFi solves these issues perfectly. With its 16MP UHD clarity and dual 4K sensors, the Duo 3 WiFi stands out capturing the finest details and identifying objects within the surveillance area. Users can manually zoom in on the captured footage to discern intricate details like distant license plates. With the industry-leading image stitching algorithm technology, this dual-lens camera seamlessly merges two images into one with virtually minimal distortion and provides a seamless 180° ultra wide view, ensuring a complete coverage of home or business.
The Duo 3 WiFi also features the dual-band Wi-Fi 6 capability, supporting both 2.4GHz and 5GHz frequencies for faster and more stable live streaming. Besides, the Motion Track condenses 15 seconds of motion events into one single image, facilitating users to review recent events without spending hours of sifting through recordings.
With all these features, this camera is ideal for both home and outdoor surveillance, providing detailed and complete security for large yards, wide parking lots, extended driveways and more.
Starting today, the Duo 3 WiFi is available for purchase in North America and Europe, with MSRP at $179.99 and €189.99. Customers can buy it from the Reolink website and Amazon.
Altas Series: Round-the-Clock Protection
Last September, Reolink launched the Altas PT Ultra, an industry-leading 4K continuous recording battery camera with a 360° blindspot-free view. Since the product’s release, the company has continued striving for excellence, extending the recording time from 96-hours on a single charge to 24/7 – perfectly meeting users’ demand for around-the-clock protection.
Reolink today introduces the new Altas Series, the world’s first 24/7 continuous recording battery-powered camera lineup, including the bullet-style 2K Altas with WiFi connectivity, the 4G battery camera Altas Go PT with a 360° blindspot-free view, and a future upgraded version for Altas PT Ultra with 24/7 continuous recording capability. Whether in on-grid or off-grid environments, the Altas Series’ products meet the needs of users.
With battery capacity of 20,000 mAh, Altas series provides 24-hour continuous recording per day for up to 7 days, thanks to an innovative low power consumption solution. When paired with a solar panel, it ensures continuous recording around the clock without the need of manually recharging[1].
With a new generation of system-on-chip (SoC), these cameras can achieve pre-recording functionality, capturing 10 seconds of footage before an event is detected. Additionally, Reolink’s ColorX technology, which combines an ultra-large F1.0 aperture with a 1/1.8” sensor, ensures vibrant, full-color images both day and night, delivering four times more light than traditional infrared cameras.
To learn more about Reolink and its new products, please visit its booth at Venetian Expo, Hall A-D 52747 during CES 2025. For more information, please visit: https://reolink.com/visit-reolink-at-ces/.
About Reolink
Reolink offers smart security solutions for homes and businesses, aiming for a seamless security experience with its wide range of products. Serving millions globally, it provides video surveillance and protection, standing out for its commitment to security technology innovation.
[1] Solar panels come as standard for this series. 2 hours of daily sunlight for a 6W Solar Panel is required for continuous recording or pre-recording; while 1 hour of daily sunlight for a 12W Solar Panel is required for continuous recording and pre-recording.
View original content to download multimedia:https://www.prnewswire.com/news-releases/reolink-debuts-16mp-wi-fi-camera–continuous-recording-battery-cam-series-at-ces-2025-302344893.html
SOURCE Reolink Innovation Inc.
Technology
Output Management Software Market to Grow by USD 10.67 Billion (2025-2029), Driven by Healthcare Adoption and AI-Driven Market Transformation – Technavio
Published
27 minutes agoon
January 7, 2025By
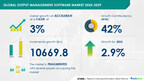
NEW YORK, Jan. 7, 2025 /PRNewswire/ — Report with the AI impact on market trends – The global output management software market size is estimated to grow by USD 10.67 billion from 2025-2029, according to Technavio. The market is estimated to grow at a CAGR of almost 3% during the forecast period. Increased use of output management software solutions in healthcare industry is driving market growth, with a trend towards outsourcing of output management services. However, growing concerns over data security poses a challenge. Key market players include Broadcom Inc., CSG Systems International Inc., DOCPATH DOCUMENT SOLUTIONS SL, HP Inc., ISIS Papyrus Europe AG, kuhn and weyh Software GmbH, Kyocera Corp., LBM Systems LLC, LEVI RAY AND SHOUP INC., Lexmark International Inc., Open Text Corp., Pitney Bowes Inc., Plus Technologies LLC, QUADIENT, Ricoh Co. Ltd., Rochester Software Associates Inc., SEAL Systems AG, Stargel Office Solutions, Symtrax, and UNICOM .
Key insights into market evolution with AI-powered analysis. Explore trends, segmentation, and growth drivers- View Free Sample PDF
Output Management Software Market Scope
Report Coverage
Details
Base year
2024
Historic period
2019 – 2023
Forecast period
2025-2029
Growth momentum & CAGR
Accelerate at a CAGR of 3%
Market growth 2025-2029
USD 10669.8 million
Market structure
Fragmented
YoY growth 2022-2023 (%)
2.9
Regional analysis
North America, APAC, Europe, Middle East and Africa, and South America
Performing market contribution
APAC at 42%
Key countries
US, China, Germany, Japan, Canada, UK, India, France, Italy, and Saudi Arabia
Key companies profiled
Broadcom Inc., CSG Systems International Inc., DOCPATH DOCUMENT SOLUTIONS SL, HP Inc., ISIS Papyrus Europe AG, kuhn and weyh Software GmbH, Kyocera Corp., LBM Systems LLC, LEVI RAY AND SHOUP INC., Lexmark International Inc., Open Text Corp., Pitney Bowes Inc., Plus Technologies LLC, QUADIENT, Ricoh Co. Ltd., Rochester Software Associates Inc., SEAL Systems AG, Stargel Office Solutions, Symtrax, and UNICOM Global
The Output Management Software Market is witnessing significant growth due to the increasing trend towards digital transformation in various industries. Document management, email communications, and portals are key areas where output management software is being adopted. Large Enterprises in sectors like healthcare, education, banking, and IT are automating paperwork and printing of documents using workflow management systems and printing tools. Customer relationship management and enterprise resource planning systems are also integrating output management capabilities. Automation of administrative tasks, printing of system-generated documents, and outsourcing of printing are driving the market. Cloud-based and on-premises solutions cater to different business needs. Trends such as paperless operations, personalizing output communications, and e-commerce integration are gaining traction. The manufacturing sector is adopting output management software for automating manual tasks and improving business continuity planning. Sustainable development and cybersecurity concerns are also influencing the market. Cloud-based technologies, software compatibility, data access, and data theft are key considerations for businesses. The market is expected to grow further with the adoption of big data analytics and Internet of Things technologies. Electronic documents, invoices, and printed letters are common use cases for output management software. Digital transformation initiatives are driving the demand for efficient and secure output management solutions.
The output management software market is witnessing a significant trend with companies outsourcing print-related activities to Asia. This includes tasks such as document management and the printing process. By outsourcing these functions, firms can concentrate on their core competencies, like research and development and product creation. The Asia Pacific region is a major hub for this outsourcing activity, leading to a heightened demand for output management software in this area. A substantial portion of outsourcing is focused on operational print activities, involving materials like memos, brochures, stationery, and manuals.
Request Sample of our comprehensive report now to stay ahead in the AI-driven market evolution!
• The Output Management Software Market faces various challenges in document management, particularly with emails, portals, and paperwork. Large Enterprises in industries like healthcare, education, banking, and IT deal with numerous administrative tasks, printer management, and workflow systems. Printing of documents, customer relationship management, and enterprise resource planning add to the complexity. Automation of manual tasks and personalizing output communications are key to digital transformation initiatives. Challenges include software compatibility, data access, and security concerns such as data theft and cyber security. System-generated documents and outsourcing require careful consideration. Paperless operations are a goal, but printing remains necessary for some industries and applications. Sustainable development and e-commerce industries also impact the market. Cloud-based and on-premises solutions offer benefits, with cloud-based technologies gaining popularity. Services like electronic documents and big data analytics are transforming business processes. The market must address challenges in printing tools, electrical forms, operating systems, and IT industry standards. Manufacturing industries seek to automate manual tasks and personalize output communications. Internet of Things integration and business continuity planning are essential for future growth. Overall, the Output Management Software Market must adapt to meet the evolving needs of various industries and businesses.
• Output management software plays a crucial role in facilitating data transfer between input and output devices in businesses. However, the security of this data is a significant concern, especially in sectors like healthcare and BFSI. Output devices, such as Multi-Function Printers (MFPs), are potential entry points for security breaches. Vendors offer secure data transfer solutions, but these come with a higher price tag. Companies must carefully weigh the benefits of output management software against the potential risks and costs. Effective data security measures are essential to protect a company’s vital information and maintain its brand reputation.
Discover how AI is revolutionizing market trends- Get your access now!
This output management software market report extensively covers market segmentation by
End-user 1.1 BFSI1.2 Healthcare1.3 Manufacturing1.4 OthersDeployment 2.1 Cloud2.2 On-premisesGeography 3.1 North America3.2 APAC3.3 Europe3.4 Middle East and Africa3.5 South America
1.1 BFSI- In the banking, financial services, and insurance (BFSI) sector, output management software plays a crucial role in handling sensitive documents securely and complying with industry regulations. With a substantial volume of documents daily, output management software is essential for document scanning, optical character recognition (OCR), and form processing solutions. This software helps BFSI organizations achieve better security, cost reduction, and improved traceability. Additionally, it facilitates personalized and timely customer communication, enhancing the overall customer experience and satisfaction. Financial institutions require multi-channel document delivery, and output management software enables seamless delivery via preferred channels. JPMorgan Chase and Wells Fargo are prominent users, streamlining document workflows and managing diverse document types. RBC Capital Markets reduced costs by 30% using HP Managed Print Services, addressing challenges like high printing requirements, obsolete devices, and frequent repairs. The BFSI sector’s focus on document security, compliance, digital transformation, efficient document workflows, and cost reduction will fuel the demand for output management software, boosting the BFSI segment’s growth in the market.
Download a Sample of our comprehensive report today to discover how AI-driven innovations are reshaping competitive dynamics
The Output Management Software market is a significant segment of the IT industry, focusing on managing and optimizing the production, delivery, and archiving of various types of business documents. This software plays a crucial role in streamlining document-intensive processes, reducing manual tasks, and enhancing business efficiency. The market caters to various sectors, including the document management, customer relationship management, enterprise resource planning, E Commerce industry, and more. Output Management Software supports multiple formats, including emails, portals, paperwork, and electronic documents. Key applications include printing, personalizing output communications, and ensuring business continuity planning. It is essential for industries dealing with large volumes of paperwork, such as financial services, healthcare, and government, to adopt Output Management Software for sustainable development and cost savings. Moreover, the software supports digital transformation initiatives by enabling seamless integration with Operating Systems and other business applications, ensuring the secure and timely delivery of information to various stakeholders. The market is witnessing significant growth due to the increasing demand for efficient document management, reducing reliance on printed letters, invoices, and other physical documents.
The Output Management Software market encompasses solutions that manage and automate the production and delivery of various forms of business documents, including emails, portals, and printed documents. These systems streamline administrative tasks, such as document management, workflow management, and customer relationship management, in industries like healthcare, education, banking, and IT. Automation of printing tools and the integration with ERP and CRM systems are key features. Cloud-based and on-premises solutions cater to large enterprises and small businesses, offering paperless operations and sustainable development. Services range from document creation to data access and security, including system-generated documents, outsourcing, and compliance with operating systems and software compatibility. Output Management Software supports digital transformation initiatives, enabling personalizing output communications, e-commerce, and business continuity planning. Big data analytics and IoT integration add value, while addressing concerns like data theft and cybersecurity. The market continues to evolve, offering innovative solutions for various industries and use cases.
1 Executive Summary
2 Market Landscape
3 Market Sizing
4 Historic Market Size
5 Five Forces Analysis
6 Market Segmentation
End-userBFSIHealthcareManufacturingOthersDeploymentCloudOn-premisesGeographyNorth AmericaAPACEuropeMiddle East And AfricaSouth America
7 Customer Landscape
8 Geographic Landscape
9 Drivers, Challenges, and Trends
10 Company Landscape
11 Company Analysis
12 Appendix
Technavio is a leading global technology research and advisory company. Their research and analysis focuses on emerging market trends and provides actionable insights to help businesses identify market opportunities and develop effective strategies to optimize their market positions.
With over 500 specialized analysts, Technavio’s report library consists of more than 17,000 reports and counting, covering 800 technologies, spanning across 50 countries. Their client base consists of enterprises of all sizes, including more than 100 Fortune 500 companies. This growing client base relies on Technavio’s comprehensive coverage, extensive research, and actionable market insights to identify opportunities in existing and potential markets and assess their competitive positions within changing market scenarios.
Technavio Research
Jesse Maida
Media & Marketing Executive
US: +1 844 364 1100
UK: +44 203 893 3200
Email: media@technavio.com
Website: www.technavio.com/
View original content to download multimedia:https://www.prnewswire.com/news-releases/output-management-software-market-to-grow-by-usd-10-67-billion-2025-2029-driven-by-healthcare-adoption-and-ai-driven-market-transformation—technavio-302342663.html
SOURCE Technavio

LG Electronics and Samsung Unveil Cutting Edge Shoppable TV Capabilities Powered by TheTake.AI at CES 2025

Reolink Debuts 16MP Wi-Fi Camera & Continuous Recording Battery Cam Series at CES 2025

Output Management Software Market to Grow by USD 10.67 Billion (2025-2029), Driven by Healthcare Adoption and AI-Driven Market Transformation – Technavio

Whiteboard Series with NEAR | Ep: 45 Joel Thorstensson from ceramic.network

Peloton Unveils Holiday 2022 Creative Campaign Highlighting How Motivation Transcends Beyond the Workout

These ’90s fashion trends are making a comeback in 2017

Why You Should Build on #NEAR – Co-founder Illia Polosukhin at CV Labs
Whiteboard Series with NEAR | Ep: 45 Joel Thorstensson from ceramic.network

NEAR End of Year Town Hall 2021: The Open Web World, MetaBUILD 2 Hackathon and 2021 recap
Trending
-

 Technology4 days ago
SandboxAQ Publishes Scientific and Technical Milestones for Cybersecurity
-

 Technology4 days ago
CES 2025: JMGO Showcases the Future of Projectors with AI-Powered ‘Bright, Even in Sunlight’ Innovation
-

 Technology4 days ago
A. O. Smith to Hold Fourth Quarter Conference Call on January 30, 2025
-

 Coin Market4 days ago
Crypto VCs reveal what they’re looking for in 2025
-

 Coin Market4 days ago
Phishing scams top crypto security threat of 2024 — CertiK
-

 Technology4 days ago
Interest-Driven Consumption Sparks ¥ 500B ACG Goods Market, MINISO Rides the Wave
-

 Technology4 days ago
Artronic Design Unveils Komutr, World’s First MagSafe Earbuds at CES 2025
-

 Technology4 days ago
Canela Media Appoints Philippe Guelton as Global President