
Technology
HONEYWELL DELIVERS STRONG SECOND QUARTER RESULTS AND BEATS EARNINGS GUIDANCE; UPDATES 2024 OUTLOOK
Published
6 months agoon
By
Sales of $9.6 Billion, Reported Sales Up 5%, Organic1 Sales Up 4%, Achieving the High End of Previous GuidanceEarnings Per Share of $2.36 and Adjusted Earnings Per Share1 of $2.49, Above High End of Previous GuidanceOrders Up 4%, Led by Strength in Our Building Automation and Energy and Sustainability Solutions BusinessesDeployed $6.4 Billion of Capital to M&A, Dividends, Share Repurchases, and Capital Expenditures, Including Closing the $5 Billion Acquisition of Access Solutions, and Announcing the $1.9 Billion Acquisition of CAES Systems Holdings and the $1.8 Billion Acquisition of Air Products’ LNG Business
CHARLOTTE, N.C., July 25, 2024 /PRNewswire/ — Honeywell (NASDAQ: HON) today announced results for the second quarter that met or exceeded the company’s guidance. The company also updated its full-year sales, segment margin2, adjusted earnings per share2,3, and cash flow guidance ranges.
The company reported second-quarter year-over-year sales growth of 5% and organic1 sales growth of 4%, led by double digit organic1 sales growth in defense and space, commercial aviation, and building solutions. Operating income grew 5% and operating margin expanded 10 basis points to 20.7%, while segment profit1 grew 4% led by Aerospace Technologies. Segment margin1 contraction of 10 basis points was above the midpoint of our guidance range. Earnings per share for the second quarter was $2.36, up 6% year over year, and adjusted earnings per share1 was $2.49, up 8% year over year, above the high end of our guidance range. Operating cash flow was $1.4 billion and free cash flow1 was $1.1 billion, approximately flat year over year.
“Honeywell delivered a strong second quarter, once again meeting or exceeding guidance across all metrics while maneuvering through a dynamic operating environment,” said Vimal Kapur, chairman and chief executive officer of Honeywell. “While Aerospace continues to lead our growth, we are seeing broader participation across our portfolio, with three of our four segments contributing positive growth for the quarter. All four segments grew sequentially in the quarter as well, giving us further confidence in our expectation of a second half organic growth acceleration.”
Kapur continued, “We also made significant progress in our capital deployment strategy, deploying $6.4 billion to M&A, dividends, share repurchases, and capex, highlighted by the closing of our $5 billion acquisition of Access Solutions. We also recently announced two additional deals – the $1.9 billion acquisition of CAES Systems and the $1.8 billion acquisition of Air Products’ LNG process technology and equipment business. We continue to make significant progress on my key priorities for Honeywell as we accelerate our alignment to three powerful megatrends – automation, the future of aviation, and energy transition, all underpinned by digitalization. Together, our technologically differentiated portfolio and world-class Honeywell Accelerator operating system are poised to further unlock incremental value and enable us to achieve our long-term financial framework.”
As a result of the company’s second-quarter performance and management’s outlook for the remainder of the year, including the impact of recently announced acquisitions, Honeywell updated its full-year sales, segment margin2, adjusted earnings per share2,3, and cash flow1 guidance. Full-year sales are now expected to be $39.1 billion to $39.7 billion with organic1 sales growth in the range of 5% to 6%. Segment margin2 is now expected to be in the range of 23.3% to 23.5% with segment margin contraction2 of 20 basis points to flat year over year. Adjusted earnings per share2,3 is now expected to be in the range of $10.05 to $10.25, up 6% to 8% year over year. Operating cash flow is now expected to be in the range of $6.6 billion to $7.0 billion, with free cash flow1 of $5.5 billion to $5.9 billion. A summary of the company’s full-year guidance can be found in Table 1.
Second-Quarter Performance
Honeywell sales for the second quarter were up 5% year over year on a reported basis and 4% on an organic1 basis year over year. The second-quarter financial results can be found in Tables 2 and 3.
Aerospace Technologies sales for the second quarter increased 16% on an organic1 basis year over year, the eighth consecutive quarter of double-digit organic growth, on sustained strength in both commercial aviation and defense and space. Commercial aviation was led by 17% growth in aftermarket sales as global flight activity continued to rise. Commercial original equipment sales once again grew double digits on increased shipset deliveries, particularly in air transport. Defense and space grew 19% year over year as sustained demand from the current geopolitical climate and further supply chain improvements enabled us to convert on our robust backlog. Segment margin contracted 60 basis points year over year to 27.2%, driven by mix pressure in original equipment, partially offset by commercial excellence net of inflation.
Industrial Automation sales for the second quarter decreased 8% on an organic1 basis year over year. Sales declines were primarily driven by volume softness in warehouse and workflow solutions. While sales declined in productivity solutions and services overall, they were up year over year and sequentially excluding the impact of payments under the license and settlement agreement that ended in the first quarter. Process solutions sales grew 1% in the second quarter as continued double-digit growth in aftermarket services was partially offset by softness in thermal solutions and smart energy. Sales in our sensing and safety technologies business declined year over year, but both orders and sales improved sequentially. Segment margin contracted 90 basis points to 19.0% due to lower volume leverage and the end of payments under the license and settlement agreement.
Building Automation sales for the second quarter increased 1% on an organic1 basis year over year and increased 10% sequentially including one month of benefit from the acquisition of our access solutions business. Building solutions delivered another solid quarter, growing 14% organically, as both projects and services grew double digits. The ongoing strength in building solutions was mostly offset by declines in building products, primarily driven by lower year over year volumes in fire and building management systems; however, both businesses saw improved sales quarter over quarter. Segment margin improved sequentially for the second consecutive quarter but contracted 60 basis points year over year to 25.3%, due to product mix headwinds and cost inflation, partially offset by productivity actions and commercial excellence.
Energy and Sustainability Solutions sales for the second quarter grew 3% on an organic1 basis year over year. Advanced materials once again led ESS with 8% sales growth, led by continued strength in fluorine products. UOP sales declined 4% in the quarter as a result of previously communicated difficult year-over-year comps from large gas processing equipment projects, partially offset by growth in refining catalysts and aftermarket services. Segment margin expanded 200 basis points to 25.2%, primarily driven by productivity actions.
Conference Call Details
Honeywell will discuss its second-quarter results and full-year 2024 guidance during an investor conference call starting at 8:30 a.m. Eastern Time today. A live webcast of the investor call as well as related presentation materials will be available through the Investor Relations section of the company’s website (www.honeywell.com/investor). A replay of the webcast will be available for 30 days following the presentation.
TABLE 1: FULL-YEAR 2024 GUIDANCE2
Previous Guidance
Current Guidance
Sales
$38.5B – $39.3B
$39.1B – $39.7B
Organic1 Growth
4% – 6%
5% – 6%
Segment Margin
23.8% – 24.1%
23.3% – 23.5%
Expansion
Up 30 – 60 bps
Down 20 – Flat bps
Adjusted Earnings Per Share3
$10.15 – $10.45
$10.05 – $10.25
Adjusted Earnings Growth3
7% – 10%
6% – 8%
Operating Cash Flow
$6.7B – $7.1B
$6.6B – $7.0B
Free Cash Flow1
$5.6B – $6.0B
$5.5B – $5.9B
TABLE 2: SUMMARY OF HONEYWELL FINANCIAL RESULTS
2Q 2024
2Q 2023
Change
Sales
$9,577
$9,146
5 %
Organic1 Growth
4 %
Operating Income Margin
20.7 %
20.6 %
10 bps
Segment Profit1
$2,199
$2,113
4 %
Segment Margin1
23.0 %
23.1 %
-10 bps
Earnings Per Share
$2.36
$2.22
6 %
Adjusted Earnings Per Share1
$2.49
$2.30
8 %
Operating Cash Flow
$1,371
$1,360
1 %
Free Cash Flow1
$1,112
$1,127
(1 %)
TABLE 3: SUMMARY OF SEGMENT FINANCIAL RESULTS
AEROSPACE TECHNOLOGIES
2Q 2024
2Q 2023
Change
Sales
$3,891
$3,341
16 %
Organic1 Growth
16 %
Segment Profit
$1,060
$930
14 %
Segment Margin
27.2 %
27.8 %
-60 bps
INDUSTRIAL AUTOMATION
Sales
$2,506
$2,727
(8 %)
Organic1 Growth
(8 %)
Segment Profit
$477
$544
(12 %)
Segment Margin
19.0 %
19.9 %
-90 bps
BUILDING AUTOMATION
Sales
$1,571
$1,510
4 %
Organic1 Growth
1 %
Segment Profit
$397
$391
2 %
Segment Margin
25.3 %
25.9 %
-60 bps
ENERGY AND SUSTAINABILITY SOLUTIONS
Sales
$1,604
$1,567
2 %
Organic1 Growth
3 %
Segment Profit
$405
$363
12 %
Segment Margin
25.2 %
23.2 %
200 bps
1
See additional information at the end of this release regarding non-GAAP financial measures.
2
Segment margin and adjusted EPS are non-GAAP financial measures. Management cannot reliably predict or estimate, without unreasonable effort, the impact and timing on future operating results arising from items excluded from segment margin or adjusted EPS. We therefore, do not present a guidance range, or a reconciliation to, the nearest GAAP financial measures of operating margin or EPS.
3
Adjusted EPS and adjusted EPS V% guidance excludes items identified in the non-GAAP reconciliation of adjusted EPS at the end of this release, and any potential future one-time items that we cannot reliably predict or estimate such as pension mark-to-market.
Honeywell is an integrated operating company serving a broad range of industries and geographies around the world. Our business is aligned with three powerful megatrends – automation, the future of aviation, and energy transition – underpinned by our Honeywell Accelerator operating system and Honeywell Connected Enterprise integrated software platform. As a trusted partner, we help organizations solve the world’s toughest, most complex challenges, providing actionable solutions and innovations that help make the world smarter, safer, and more sustainable. For more news and information on Honeywell, please visit www.honeywell.com/newsroom.
Honeywell uses our Investor Relations website, www.honeywell.com/investor, as a means of disclosing information which may be of interest or material to our investors and for complying with disclosure obligations under Regulation FD. Accordingly, investors should monitor our Investor Relations website, in addition to following our press releases, SEC filings, public conference calls, webcasts, and social media.
We describe many of the trends and other factors that drive our business and future results in this release. Such discussions contain forward-looking statements within the meaning of Section 21E of the Securities Exchange Act of 1934, as amended (the Exchange Act). Forward-looking statements are those that address activities, events, or developments that management intends, expects, projects, believes or anticipates will or may occur in the future. They are based on management’s assumptions and assessments in light of past experience and trends, current economic and industry conditions, expected future developments and other relevant factors, many of which are difficult to predict and outside of our control. They are not guarantees of future performance, and actual results, developments and business decisions may differ significantly from those envisaged by our forward-looking statements. We do not undertake to update or revise any of our forward-looking statements, except as required by applicable securities law. Our forward-looking statements are also subject to material risks and uncertainties, including ongoing macroeconomic and geopolitical risks, such as lower GDP growth or recession, capital markets volatility, inflation, and certain regional conflicts, that can affect our performance in both the near- and long-term. In addition, no assurance can be given that any plan, initiative, projection, goal, commitment, expectation, or prospect set forth in this release can or will be achieved. These forward-looking statements should be considered in light of the information included in this release, our Form 10-K and other filings with the Securities and Exchange Commission. Any forward-looking plans described herein are not final and may be modified or abandoned at any time.
This release contains financial measures presented on a non-GAAP basis. Honeywell’s non-GAAP financial measures used in this release are as follows:
Segment profit, on an overall Honeywell basis;Segment profit margin, on an overall Honeywell basis;Organic sales growth;Free cash flow; andAdjusted earnings per share.
Management believes that, when considered together with reported amounts, these measures are useful to investors and management in understanding our ongoing operations and in the analysis of ongoing operating trends. These measures should be considered in addition to, and not as replacements for, the most comparable GAAP measure. Certain measures presented on a non-GAAP basis represent the impact of adjusting items net of tax. The tax-effect for adjusting items is determined individually and on a case-by-case basis. Refer to the Appendix attached to this release for reconciliations of non-GAAP financial measures to the most directly comparable GAAP measures.
Honeywell International Inc.
Consolidated Statement of Operations (Unaudited)
(Dollars in millions, except per share amounts)
Three Months Ended
June 30,
Six Months Ended
June 30,
2024
2023
2024
2023
Product sales
$ 6,477
$ 6,441
$ 12,740
$ 12,751
Service sales
3,100
2,705
5,942
5,259
Net sales
9,577
9,146
18,682
18,010
Costs, expenses and other
Cost of products sold1
4,247
4,133
8,282
8,201
Cost of services sold1
1,609
1,493
3,157
2,923
Total Cost of products and services sold
5,856
5,626
11,439
11,124
Research and development expenses
382
375
742
732
Selling, general and administrative expenses1
1,361
1,262
2,663
2,579
Other (income) expense
(246)
(208)
(477)
(468)
Interest and other financial charges
250
187
470
357
Total costs, expenses and other
7,603
7,242
14,837
14,324
Income before taxes
1,974
1,904
3,845
3,686
Tax expense
414
403
810
777
Net income
1,560
1,501
3,035
2,909
Less: Net income attributable to the noncontrolling interest
16
14
28
28
Net income attributable to Honeywell
$ 1,544
$ 1,487
$ 3,007
$ 2,881
Earnings per share of common stock – basic
$ 2.37
$ 2.24
$ 4.62
$ 4.32
Earnings per share of common stock – assuming dilution
$ 2.36
$ 2.22
$ 4.59
$ 4.29
Weighted average number of shares outstanding – basic
650.2
665.3
651.3
666.5
Weighted average number of shares outstanding – assuming dilution
654.2
670.2
655.5
671.9
1
Cost of products and services sold and Selling, general and administrative expenses include amounts for repositioning and other charges, the service cost component of pension and other postretirement (income) expense, and stock compensation expense.
Honeywell International Inc.
Segment Data (Unaudited)
(Dollars in millions)
Three Months Ended June 30,
Six Months Ended June 30,
Net Sales
2024
2023
2024
2023
Aerospace Technologies
$ 3,891
$ 3,341
$ 7,560
$ 6,452
Industrial Automation
2,506
2,727
4,984
5,530
Building Automation
1,571
1,510
2,997
2,997
Energy and Sustainability Solutions
1,604
1,567
3,129
3,028
Corporate and All Other
5
1
12
3
Total
$ 9,577
$ 9,146
$ 18,682
$ 18,010
Reconciliation of Segment Profit to Income Before Taxes
Three Months Ended June 30,
Six Months Ended June 30,
Segment Profit
2024
2023
2024
2023
Aerospace Technologies
$ 1,060
$ 930
$ 2,095
$ 1,761
Industrial Automation
477
544
951
1,130
Building Automation
397
391
747
772
Energy and Sustainability Solutions
405
363
708
665
Corporate and All Other
(140)
(115)
(208)
(200)
Total segment profit
2,199
2,113
4,293
4,128
Interest and other financial charges
(250)
(187)
(470)
(357)
Interest income
110
76
215
152
Amortization of acquisition-related intangibles
(85)
(61)
(155)
(129)
Stock compensation expense1
(55)
(50)
(108)
(109)
Pension ongoing income2
140
130
285
260
Other postretirement income2
4
7
10
13
Repositioning and other charges3,4
(44)
(102)
(137)
(243)
Other5
(45)
(22)
(88)
(29)
Income before taxes
$ 1,974
$ 1,904
$ 3,845
$ 3,686
1
Amounts included in Selling, general and administrative expenses.
2
Amounts included in Cost of products and services sold (service cost component), Selling, general and administrative expenses (service cost component), Research and development expenses (service cost component), and Other (income) expense (non-service cost component).
3
Amounts included in Cost of products and services sold, Selling, general and administrative expenses, and Other (income) expense.
4
Includes repositioning, asbestos, and environmental expenses.
5
Amounts include the other components of Other (income) expense not included within other categories in this reconciliation. Equity income of affiliated companies is included in segment profit.
Honeywell International Inc.
Consolidated Balance Sheet (Unaudited)
(Dollars in millions)
June 30, 2024
December 31, 2023
ASSETS
Current assets
Cash and cash equivalents
$ 9,576
$ 7,925
Short-term investments
231
170
Accounts receivable, less allowances of $312 and $323, respectively
7,759
7,530
Inventories
6,324
6,178
Other current assets
1,479
1,699
Total current assets
25,369
23,502
Investments and long-term receivables
1,472
939
Property, plant and equipment—net
5,752
5,660
Goodwill
20,824
18,049
Other intangible assets—net
5,208
3,231
Insurance recoveries for asbestos-related liabilities
163
170
Deferred income taxes
374
392
Other assets
10,167
9,582
Total assets
$ 69,329
$ 61,525
LIABILITIES
Current liabilities
Accounts payable
$ 6,470
$ 6,849
Commercial paper and other short-term borrowings
4,548
2,085
Current maturities of long-term debt
2,519
1,796
Accrued liabilities
7,507
7,809
Total current liabilities
21,044
18,539
Long-term debt
20,865
16,562
Deferred income taxes
2,137
2,094
Postretirement benefit obligations other than pensions
126
134
Asbestos-related liabilities
1,444
1,490
Other liabilities
6,196
6,265
Redeemable noncontrolling interest
7
7
Shareowners’ equity
17,510
16,434
Total liabilities, redeemable noncontrolling interest and shareowners’ equity
$ 69,329
$ 61,525
Honeywell International Inc.
Consolidated Statement of Cash Flows (Unaudited)
(Dollars in millions)
Three Months Ended
June 30,
Six Months Ended
June 30,
2024
2023
2024
2023
Cash flows from operating activities
Net income
$ 1,560
$ 1,501
$ 3,035
$ 2,909
Less: Net income attributable to noncontrolling interest
16
14
28
28
Net income attributable to Honeywell
1,544
1,487
3,007
2,881
Adjustments to reconcile net income attributable to Honeywell to net cash provided by
(used for) operating activities
Depreciation
163
166
329
327
Amortization
146
118
271
240
Repositioning and other charges
44
102
137
243
Net payments for repositioning and other charges
(87)
(154)
(211)
(195)
NARCO Buyout payment
—
—
—
(1,325)
Pension and other postretirement income
(144)
(137)
(295)
(273)
Pension and other postretirement benefit payments
(7)
(8)
(15)
(23)
Stock compensation expense
55
50
108
109
Deferred income taxes
(39)
(29)
(36)
196
Other
(420)
(293)
(583)
(643)
Changes in assets and liabilities, net of the effects of acquisitions and divestitures
Accounts receivable
(202)
(83)
(149)
(505)
Inventories
63
(100)
(77)
(338)
Other current assets
163
98
227
208
Accounts payable
(42)
—
(423)
114
Accrued liabilities
134
143
(471)
(440)
Net cash provided by operating activities
1,371
1,360
1,819
576
Cash flows from investing activities
Capital expenditures
(259)
(233)
(492)
(426)
Proceeds from disposals of property, plant and equipment
—
2
—
13
Increase in investments
(230)
(3)
(468)
(229)
Decrease in investments
237
246
392
632
Receipts (payments) from settlements of derivative contracts
33
(31)
76
(38)
Cash paid for acquisitions, net of cash acquired
(4,913)
(661)
(4,913)
(661)
Net cash used for investing activities
(5,132)
(680)
(5,405)
(709)
Cash flows from financing activities
Proceeds from issuance of commercial paper and other short-term borrowings
4,770
3,895
6,993
8,000
Payments of commercial paper and other short-term borrowings
(2,019)
(4,636)
(4,489)
(7,930)
Proceeds from issuance of common stock
165
78
309
115
Proceeds from issuance of long-term debt
—
2,966
5,710
2,966
Payments of long-term debt
(32)
(21)
(605)
(1,384)
Repurchases of common stock
(529)
(477)
(1,200)
(1,176)
Cash dividends paid
(743)
(691)
(1,446)
(1,416)
Other
(10)
(4)
26
(38)
Net cash provided by (used for) financing activities
1,602
1,110
5,298
(863)
Effect of foreign exchange rate changes on cash and cash equivalents
(21)
(33)
(61)
(5)
Net increase (decrease) in cash and cash equivalents
(2,180)
1,757
1,651
(1,001)
Cash and cash equivalents at beginning of period
11,756
6,869
7,925
9,627
Cash and cash equivalents at end of period
$ 9,576
$ 8,626
$ 9,576
$ 8,626
Appendix
Non-GAAP Financial Measures
The following information provides definitions and reconciliations of certain non-GAAP financial measures presented in this press release to which this reconciliation is attached to the most directly comparable financial measures calculated and presented in accordance with generally accepted accounting principles (GAAP).
Management believes that, when considered together with reported amounts, these measures are useful to investors and management in understanding our ongoing operations and in the analysis of ongoing operating trends. These measures should be considered in addition to, and not as replacements for, the most comparable GAAP measure. Certain measures presented on a non-GAAP basis represent the impact of adjusting items net of tax. The tax-effect for adjusting items is determined individually and on a case-by-case basis. Other companies may calculate these non-GAAP measures differently, limiting the usefulness of these measures for comparative purposes.
Management does not consider these non-GAAP measures in isolation or as an alternative to financial measures determined in accordance with GAAP. The principal limitations of these non-GAAP financial measures are that they exclude significant expenses and income that are required by GAAP to be recognized in the consolidated financial statements. In addition, they are subject to inherent limitations as they reflect the exercise of judgments by management about which expenses and income are excluded or included in determining these non-GAAP financial measures. Investors are urged to review the reconciliation of the non-GAAP financial measures to the comparable GAAP financial measures and not to rely on any single financial measure to evaluate Honeywell’s business.
Honeywell International Inc.
Reconciliation of Organic Sales % Change
(Unaudited)
Three Months Ended
June 30, 2024
Honeywell
Reported sales % change
5 %
Less: Foreign currency translation
— %
Less: Acquisitions, divestitures and other, net
1 %
Organic sales % change
4 %
Aerospace Technologies
Reported sales % change
16 %
Less: Foreign currency translation
— %
Less: Acquisitions, divestitures and other, net
— %
Organic sales % change
16 %
Industrial Automation
Reported sales % change
(8) %
Less: Foreign currency translation
(1) %
Less: Acquisitions, divestitures and other, net
1 %
Organic sales % change
(8) %
Building Automation
Reported sales % change
4 %
Less: Foreign currency translation
(1) %
Less: Acquisitions, divestitures and other, net
4 %
Organic sales % change
1 %
Energy and Sustainability Solutions
Reported sales % change
2 %
Less: Foreign currency translation
(1) %
Less: Acquisitions, divestitures and other, net
— %
Organic sales % change
3 %
We define organic sales percentage as the year-over-year change in reported sales relative to the comparable period, excluding the impact on sales from foreign currency translation and acquisitions, net of divestitures, for the first 12 months following the transaction date. We believe this measure is useful to investors and management in understanding our ongoing operations and in analysis of ongoing operating trends.
A quantitative reconciliation of reported sales percent change to organic sales percent change has not been provided for forward-looking measures of organic sales percent change because management cannot reliably predict or estimate, without unreasonable effort, the fluctuations in global currency markets that impact foreign currency translation, nor is it reasonable for management to predict the timing, occurrence and impact of acquisition and divestiture transactions, all of which could significantly impact our reported sales percent change.
Honeywell International Inc.
Reconciliation of Operating Income to Segment Profit, Calculation of Operating Income and Segment Profit Margins
(Unaudited)
(Dollars in millions)
Three Months Ended June 30,
Twelve Months
Ended
December 31,
2024
2023
2023
Operating income
$ 1,978
$ 1,883
$ 7,084
Stock compensation expense1
55
50
202
Repositioning, Other2,3
58
103
952
Pension and other postretirement service costs3
16
16
66
Amortization of acquisition-related intangibles
85
61
292
Acquisition-related costs4
7
—
2
Segment profit
$ 2,199
$ 2,113
$ 8,598
Operating income
$ 1,978
$ 1,883
$ 7,084
÷ Net sales
$ 9,577
$ 9,146
$ 36,662
Operating income margin %
20.7 %
20.6 %
19.3 %
Segment profit
$ 2,199
$ 2,113
$ 8,598
÷ Net sales
$ 9,577
$ 9,146
$ 36,662
Segment profit margin %
23.0 %
23.1 %
23.5 %
1
Included in Selling, general and administrative expenses.
2
Includes repositioning, asbestos, environmental expenses, equity income adjustment, and other charges. For the three months ended June 30, 2023, other charges include $2 million of benefit due to the Russia-Ukraine conflict.
3
Included in Cost of products and services sold and Selling, general and administrative expenses.
4
Includes acquisition-related fair value adjustments to inventory.
We define operating income as net sales less total cost of products and services sold, research and development expenses, and selling, general and administrative expenses. We define segment profit, on an overall Honeywell basis, as operating income, excluding stock compensation expense, pension and other postretirement service costs, amortization of acquisition-related intangibles, certain acquisition-related costs, and repositioning and other charges. We define segment profit margin, on an overall Honeywell basis, as segment profit divided by net sales. We believe these measures are useful to investors and management in understanding our ongoing operations and in analysis of ongoing operating trends.
A quantitative reconciliation of operating income to segment profit, on an overall Honeywell basis, has not been provided for all forward-looking measures of segment profit and segment profit margin included herein. Management cannot reliably predict or estimate, without unreasonable effort, the impact and timing on future operating results arising from items excluded from segment profit, particularly pension mark-to-market expense as it is dependent on macroeconomic factors, such as interest rates and the return generated on invested pension plan assets. The information that is unavailable to provide a quantitative reconciliation could have a significant impact on our reported financial results. To the extent quantitative information becomes available without unreasonable effort in the future, and closer to the period to which the forward-looking measures pertain, a reconciliation of operating income to segment profit will be included within future filings.
Acquisition amortization and acquisition-related costs are significantly impacted by the timing, size, and number of acquisitions we complete and are not on a predictable cycle, and we make no comment as to when or whether any future acquisitions may occur. We believe excluding these costs provides investors with a more meaningful comparison of operating performance over time and with both acquisitive and other peer companies.
Honeywell International Inc.
Reconciliation of Earnings per Share to Adjusted Earnings per Share
(Unaudited)
Three Months Ended June 30,
Twelve Months Ended December 31,
2024
2023
2023
2024(E)
Earnings per share of common stock – diluted1
$ 2.36
$ 2.22
$ 8.47
$9.48 – $9.68
Pension mark-to-market expense2
—
—
0.19
No Forecast
Amortization of acquisition-related intangibles3
0.10
0.07
0.35
0.48
Acquisition-related costs4
0.03
—
0.01
0.07
Russian-related charges5
—
—
—
0.02
Net expense related to the NARCO Buyout and HWI Sale6
—
0.01
0.01
—
Adjustment to estimated future Bendix liability7
—
—
0.49
—
Adjusted earnings per share of common stock – diluted
$ 2.49
$ 2.30
$ 9.52
$10.05 – $10.25
1
For the three months ended June 30, 2024, and 2023, adjusted earnings per share utilizes weighted average shares of approximately 654.2 million and 670.2 million, respectively. For the twelve months ended December 31, 2023, adjusted earnings per share utilizes weighted average shares of approximately 668.2 million. For the twelve months ended December 31, 2024, expected earnings per share utilizes weighted average shares of approximately 655 million.
2
Pension mark-to-market expense uses a blended tax rate of 18%, net of tax benefit of $27 million, for 2023.
3
For the three months ended June 30, 2024, acquisition-related intangibles amortization includes approximately $66 million, net of tax benefit of approximately $19 million. For the three months ended June 30, 2023, and twelve months ended December 31, 2023, acquisition-related intangibles amortization includes $48 million and $231 million, net of tax benefit of approximately $13 million and $61 million, respectively. For the twelve months ended December 31, 2024, expected acquisition-related intangibles amortization includes approximately $315 million, net of tax benefit of approximately $85 million.
4
For the three months ended June 30, 2024, the adjustment for acquisition-related costs, which is principally comprised of third-party transaction and integration costs and acquisition-related fair value adjustments to inventory, is approximately $22 million, net of tax benefit of approximately $7 million. For the three months ended June 30, 2023, and twelve months ended December 31, 2023, the adjustment for acquisition-related costs, which is principally comprised of third-party transaction and integration costs and acquisition-related fair value adjustments to inventory, is approximately $1 million and $7 million, net of tax benefit of approximately $0 million and $2 million, respectively. For the twelve months ended December 31, 2024, the expected adjustment for acquisition-related costs, which is principally comprised of third-party transaction and integration costs and acquisition-related fair value adjustments to inventory, is approximately $45 million, net of tax benefit of approximately $15 million.
5
For the three months ended June 30, 2023, the adjustment was $1 million, without tax benefit. For the twelve months ended December 31, 2023, the adjustment was a benefit $3 million, without tax expense. For the twelve months ended December 31, 2024, the expected adjustment is a $17 million expense, without tax benefit, due to the settlement of a contractual dispute with a Russian entity associated with the Company’s suspension and wind down activities in Russia.
6
For the three months ended June 30, 2023 and the twelve months ended December 31, 2023, the adjustment was $8 million, net of tax benefit of $3 million, due to the net expense related to the NARCO Buyout and HWI Sale.
7
Bendix Friction Materials (“Bendix”) is a business no longer owned by the Company. In 2023, the Company changed its valuation methodology for calculating legacy Bendix liabilities. For the twelve months ended December 31, 2023, the adjustment was $330 million, net of tax benefit of $104 million (or $434 million pre-tax) due to a change in the estimated liability for resolution of asserted (claims filed as of the financial statement date) and unasserted Bendix-related asbestos claims. The Company experienced fluctuations in average resolution values year-over-year in each of the past five years with no well-established trends in either direction. In 2023, the Company observed two consecutive years of increasing average resolution values (2023 and 2022), with more volatility in the earlier years of the five-year period (2019 through 2021). Based on these observations, the Company, during its annual review in the fourth quarter of 2023, reevaluated its valuation methodology and elected to give more weight to the two most recent years by shortening the look-back period from five years to two years (2023 and 2022). The Company believes that the average resolution values in the last two consecutive years are likely more representative of expected resolution values in future periods. The $434 million pre-tax amount was attributable primarily to shortening the look-back period to the two most recent years, and to a lesser extent to increasing expected resolution values for a subset of asserted claims to adjust for higher claim values in that subset than in the modelled two-year data set. It is not possible to predict whether such resolution values will increase, decrease, or stabilize in the future, given recent litigation trends within the tort system and the inherent uncertainty in predicting the outcome of such trends. The Company will continue to monitor Bendix claim resolution values and other trends within the tort system to assess the appropriate look-back period for determining average resolution values going forward.
We define adjusted earnings per share as diluted earnings per share adjusted to exclude various charges as listed above. We believe adjusted earnings per share is a measure that is useful to investors and management in understanding our ongoing operations and in analysis of ongoing operating trends. For forward-looking information, management cannot reliably predict or estimate, without unreasonable effort, the pension mark-to-market expense as it is dependent on macroeconomic factors, such as interest rates and the return generated on invested pension plan assets. We therefore do not include an estimate for the pension mark-to-market expense. Based on economic and industry conditions, future developments, and other relevant factors, these assumptions are subject to change.
Acquisition amortization and acquisition-related costs are significantly impacted by the timing, size, and number of acquisitions we complete and are not on a predictable cycle and we make no comment as to when or whether any future acquisitions may occur. We believe excluding these costs provides investors with a more meaningful comparison of operating performance over time and with both acquisitive and other peer companies.
Honeywell International Inc.
Reconciliation of Cash Provided by Operating Activities to Free Cash Flow
(Unaudited)
(Dollars in millions)
Three Months Ended
June 30, 2024
Three Months Ended
June 30, 2023
Cash provided by operating activities
$ 1,371
$ 1,360
Capital expenditures
(259)
(233)
Free cash flow
$ 1,112
$ 1,127
We define free cash flow as cash provided by operating activities less cash for capital expenditures.
We believe that free cash flow is a non-GAAP measure that is useful to investors and management as a measure of cash generated by operations that will be used to repay scheduled debt maturities and can be used to invest in future growth through new business development activities or acquisitions, pay dividends, repurchase stock, or repay debt obligations prior to their maturities. This measure can also be used to evaluate our ability to generate cash flow from operations and the impact that this cash flow has on our liquidity.
Honeywell International Inc.
Reconciliation of Expected Cash Provided by Operating Activities to Expected Free Cash Flow
(Unaudited)
Twelve Months Ended
December 31, 2024(E) ($B)
Cash provided by operating activities
~$6.6 – $7.0
Capital expenditures
~(1.1)
Free cash flow
~$5.5 – $5.9
We define free cash flow as cash provided by operating activities less cash for capital expenditures.
We believe that free cash flow is a non-GAAP measure that is useful to investors and management as a measure of cash generated by operations that will be used to repay scheduled debt maturities and can be used to invest in future growth through new business development activities or acquisitions, pay dividends, repurchase stock, or repay debt obligations prior to their maturities. This measure can also be used to evaluate our ability to generate cash flow from operations and the impact that this cash flow has on our liquidity.
Contacts:
Media
Investor Relations
Stacey Jones
Sean Meakim
(980) 378-6258
(704) 627-6200
View original content to download multimedia:https://www.prnewswire.com/news-releases/honeywell-delivers-strong-second-quarter-results-and-beats-earnings-guidance-updates-2024-outlook-302206009.html
SOURCE Honeywell

You may like
Technology
LG Electronics and Samsung Unveil Cutting Edge Shoppable TV Capabilities Powered by TheTake.AI at CES 2025
Published
44 minutes agoon
January 7, 2025By
LAS VEGAS, Jan. 7, 2025 /PRNewswire/ — TheTake, the leader in AI-powered shoppable TV technology, today announced groundbreaking partnerships with LG Electronics and Samsung Electronics at the 2025 Consumer Electronics Show (CES) in Las Vegas. These collaborations significantly expand TheTake’s reach and capabilities, further solidifying its position as the premier platform for interactive, shoppable television experiences.
Building on TheTake’s impressive multiplatform footprint of 32 million devices and exceptional user engagement achieved in 2024, these partnerships represent a major leap forward for the Shoppable TV space.
LG Electronics Integrates ‘Click to Search’ Functionality
LG Electronics showcased an innovative ‘Click to Search’ feature powered by TheTake’s cutting-edge real-time AI shopping technology. The functionality enables LG viewers to instantly search for and identify virtually any person or product on screen by simply clicking on them with their LG Magic Remote. Viewers can then shop all their favorite products through a seamless and secure purchase flow, completing transactions effortlessly with LG’s webOS Pay functionality.
“Our partnership with LG Electronics is a testament to the power of AI in transforming how viewers engage with content on television,” said Tyler Cooper, CEO of TheTake. “By integrating our real-time shopping technology with LG’s innovative Magic Remote, we’re making it easier than ever for viewers to bring the products they love into their lives.”
Samsung Electronics Introduces Revolutionary Shoppable TV Features
Samsung Electronics, in partnership with TheTake, unveiled a suite of groundbreaking shoppable TV experiences.
Trending TV Shopping – Viewers can browse and shop for trending products appearing in today’s top linear and streaming programming directly through their Samsung TVs.Enhanced Shopping via Daily+ and Daily Board Interfaces – Samsung’s unique interfaces allow for highly engaging experiences, providing brands with unparalleled opportunities to reach high intent audiences in a premium CTV environment.
“Our partnership with Samsung Electronics represents a huge step forward for TheTake,” said Tyler Cooper, CEO of TheTake. “By leveraging Samsung’s innovative interfaces, we’re able to deliver high intent, engaging shopping experiences to consumers and brands alike.”
Driving Innovation and Market Leadership
Together, LG and Samsung account for a combined 59% of the U.S. smart TV market share, positioning TheTake as the leader in the fast-evolving Shoppable TV space. These collaborations follow TheTake’s 2024 partnership announcements with global sports streaming giant DAZN and emerging smart TV OEM Telly.
About TheTake
TheTake’s AI-powered technology is redefining how consumers interact with television by transforming passive viewing into an engaging, shoppable experience. With these new partnerships, TheTake continues to innovate and lead the charge in making TV content actionable for viewers and brands.
For More Information
Contact: info@thetake.com
Visit: [www.thetake.ai](http://www.thetake.ai)
Press Contacts:
TheTake Public Relations Team
press@thetake.com
View original content to download multimedia:https://www.prnewswire.com/news-releases/lg-electronics-and-samsung-unveil-cutting-edge-shoppable-tv-capabilities-powered-by-thetakeai-at-ces-2025-302344888.html
SOURCE TheTake
Technology
Reolink Debuts 16MP Wi-Fi Camera & Continuous Recording Battery Cam Series at CES 2025
Published
44 minutes agoon
January 7, 2025By

LAS VEGAS, Jan. 7, 2025 /PRNewswire/ — Reolink, an innovative leader in intelligent visual technology for the home, today launches the Duo 3 WiFi at CES 2025. It is a 16MP UHD plug-in Wi-Fi camera with expansive 180° panoramic view, a new addition to Reolink’s groundbreaking 16MP series. Reolink also announces to release a new product line-up, the Altas Series – a range of battery-powered cameras designed for 24/7 continuous recording on a single charge. These new products underscore the company’s commitment to driving home security forward and enhancing daily life with user-centric innovation.
Reolink Duo 3 WiFi: 16MP Crystal-Clear Details and 180° Coverage
Struggling with blurry details, blind spots, or slow streaming? Reolink Duo 3 WiFi solves these issues perfectly. With its 16MP UHD clarity and dual 4K sensors, the Duo 3 WiFi stands out capturing the finest details and identifying objects within the surveillance area. Users can manually zoom in on the captured footage to discern intricate details like distant license plates. With the industry-leading image stitching algorithm technology, this dual-lens camera seamlessly merges two images into one with virtually minimal distortion and provides a seamless 180° ultra wide view, ensuring a complete coverage of home or business.
The Duo 3 WiFi also features the dual-band Wi-Fi 6 capability, supporting both 2.4GHz and 5GHz frequencies for faster and more stable live streaming. Besides, the Motion Track condenses 15 seconds of motion events into one single image, facilitating users to review recent events without spending hours of sifting through recordings.
With all these features, this camera is ideal for both home and outdoor surveillance, providing detailed and complete security for large yards, wide parking lots, extended driveways and more.
Starting today, the Duo 3 WiFi is available for purchase in North America and Europe, with MSRP at $179.99 and €189.99. Customers can buy it from the Reolink website and Amazon.
Altas Series: Round-the-Clock Protection
Last September, Reolink launched the Altas PT Ultra, an industry-leading 4K continuous recording battery camera with a 360° blindspot-free view. Since the product’s release, the company has continued striving for excellence, extending the recording time from 96-hours on a single charge to 24/7 – perfectly meeting users’ demand for around-the-clock protection.
Reolink today introduces the new Altas Series, the world’s first 24/7 continuous recording battery-powered camera lineup, including the bullet-style 2K Altas with WiFi connectivity, the 4G battery camera Altas Go PT with a 360° blindspot-free view, and a future upgraded version for Altas PT Ultra with 24/7 continuous recording capability. Whether in on-grid or off-grid environments, the Altas Series’ products meet the needs of users.
With battery capacity of 20,000 mAh, Altas series provides 24-hour continuous recording per day for up to 7 days, thanks to an innovative low power consumption solution. When paired with a solar panel, it ensures continuous recording around the clock without the need of manually recharging[1].
With a new generation of system-on-chip (SoC), these cameras can achieve pre-recording functionality, capturing 10 seconds of footage before an event is detected. Additionally, Reolink’s ColorX technology, which combines an ultra-large F1.0 aperture with a 1/1.8” sensor, ensures vibrant, full-color images both day and night, delivering four times more light than traditional infrared cameras.
To learn more about Reolink and its new products, please visit its booth at Venetian Expo, Hall A-D 52747 during CES 2025. For more information, please visit: https://reolink.com/visit-reolink-at-ces/.
About Reolink
Reolink offers smart security solutions for homes and businesses, aiming for a seamless security experience with its wide range of products. Serving millions globally, it provides video surveillance and protection, standing out for its commitment to security technology innovation.
[1] Solar panels come as standard for this series. 2 hours of daily sunlight for a 6W Solar Panel is required for continuous recording or pre-recording; while 1 hour of daily sunlight for a 12W Solar Panel is required for continuous recording and pre-recording.
View original content to download multimedia:https://www.prnewswire.com/news-releases/reolink-debuts-16mp-wi-fi-camera–continuous-recording-battery-cam-series-at-ces-2025-302344893.html
SOURCE Reolink Innovation Inc.
Technology
Output Management Software Market to Grow by USD 10.67 Billion (2025-2029), Driven by Healthcare Adoption and AI-Driven Market Transformation – Technavio
Published
44 minutes agoon
January 7, 2025By
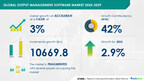
NEW YORK, Jan. 7, 2025 /PRNewswire/ — Report with the AI impact on market trends – The global output management software market size is estimated to grow by USD 10.67 billion from 2025-2029, according to Technavio. The market is estimated to grow at a CAGR of almost 3% during the forecast period. Increased use of output management software solutions in healthcare industry is driving market growth, with a trend towards outsourcing of output management services. However, growing concerns over data security poses a challenge. Key market players include Broadcom Inc., CSG Systems International Inc., DOCPATH DOCUMENT SOLUTIONS SL, HP Inc., ISIS Papyrus Europe AG, kuhn and weyh Software GmbH, Kyocera Corp., LBM Systems LLC, LEVI RAY AND SHOUP INC., Lexmark International Inc., Open Text Corp., Pitney Bowes Inc., Plus Technologies LLC, QUADIENT, Ricoh Co. Ltd., Rochester Software Associates Inc., SEAL Systems AG, Stargel Office Solutions, Symtrax, and UNICOM .
Key insights into market evolution with AI-powered analysis. Explore trends, segmentation, and growth drivers- View Free Sample PDF
Output Management Software Market Scope
Report Coverage
Details
Base year
2024
Historic period
2019 – 2023
Forecast period
2025-2029
Growth momentum & CAGR
Accelerate at a CAGR of 3%
Market growth 2025-2029
USD 10669.8 million
Market structure
Fragmented
YoY growth 2022-2023 (%)
2.9
Regional analysis
North America, APAC, Europe, Middle East and Africa, and South America
Performing market contribution
APAC at 42%
Key countries
US, China, Germany, Japan, Canada, UK, India, France, Italy, and Saudi Arabia
Key companies profiled
Broadcom Inc., CSG Systems International Inc., DOCPATH DOCUMENT SOLUTIONS SL, HP Inc., ISIS Papyrus Europe AG, kuhn and weyh Software GmbH, Kyocera Corp., LBM Systems LLC, LEVI RAY AND SHOUP INC., Lexmark International Inc., Open Text Corp., Pitney Bowes Inc., Plus Technologies LLC, QUADIENT, Ricoh Co. Ltd., Rochester Software Associates Inc., SEAL Systems AG, Stargel Office Solutions, Symtrax, and UNICOM Global
The Output Management Software Market is witnessing significant growth due to the increasing trend towards digital transformation in various industries. Document management, email communications, and portals are key areas where output management software is being adopted. Large Enterprises in sectors like healthcare, education, banking, and IT are automating paperwork and printing of documents using workflow management systems and printing tools. Customer relationship management and enterprise resource planning systems are also integrating output management capabilities. Automation of administrative tasks, printing of system-generated documents, and outsourcing of printing are driving the market. Cloud-based and on-premises solutions cater to different business needs. Trends such as paperless operations, personalizing output communications, and e-commerce integration are gaining traction. The manufacturing sector is adopting output management software for automating manual tasks and improving business continuity planning. Sustainable development and cybersecurity concerns are also influencing the market. Cloud-based technologies, software compatibility, data access, and data theft are key considerations for businesses. The market is expected to grow further with the adoption of big data analytics and Internet of Things technologies. Electronic documents, invoices, and printed letters are common use cases for output management software. Digital transformation initiatives are driving the demand for efficient and secure output management solutions.
The output management software market is witnessing a significant trend with companies outsourcing print-related activities to Asia. This includes tasks such as document management and the printing process. By outsourcing these functions, firms can concentrate on their core competencies, like research and development and product creation. The Asia Pacific region is a major hub for this outsourcing activity, leading to a heightened demand for output management software in this area. A substantial portion of outsourcing is focused on operational print activities, involving materials like memos, brochures, stationery, and manuals.
Request Sample of our comprehensive report now to stay ahead in the AI-driven market evolution!
• The Output Management Software Market faces various challenges in document management, particularly with emails, portals, and paperwork. Large Enterprises in industries like healthcare, education, banking, and IT deal with numerous administrative tasks, printer management, and workflow systems. Printing of documents, customer relationship management, and enterprise resource planning add to the complexity. Automation of manual tasks and personalizing output communications are key to digital transformation initiatives. Challenges include software compatibility, data access, and security concerns such as data theft and cyber security. System-generated documents and outsourcing require careful consideration. Paperless operations are a goal, but printing remains necessary for some industries and applications. Sustainable development and e-commerce industries also impact the market. Cloud-based and on-premises solutions offer benefits, with cloud-based technologies gaining popularity. Services like electronic documents and big data analytics are transforming business processes. The market must address challenges in printing tools, electrical forms, operating systems, and IT industry standards. Manufacturing industries seek to automate manual tasks and personalize output communications. Internet of Things integration and business continuity planning are essential for future growth. Overall, the Output Management Software Market must adapt to meet the evolving needs of various industries and businesses.
• Output management software plays a crucial role in facilitating data transfer between input and output devices in businesses. However, the security of this data is a significant concern, especially in sectors like healthcare and BFSI. Output devices, such as Multi-Function Printers (MFPs), are potential entry points for security breaches. Vendors offer secure data transfer solutions, but these come with a higher price tag. Companies must carefully weigh the benefits of output management software against the potential risks and costs. Effective data security measures are essential to protect a company’s vital information and maintain its brand reputation.
Discover how AI is revolutionizing market trends- Get your access now!
This output management software market report extensively covers market segmentation by
End-user 1.1 BFSI1.2 Healthcare1.3 Manufacturing1.4 OthersDeployment 2.1 Cloud2.2 On-premisesGeography 3.1 North America3.2 APAC3.3 Europe3.4 Middle East and Africa3.5 South America
1.1 BFSI- In the banking, financial services, and insurance (BFSI) sector, output management software plays a crucial role in handling sensitive documents securely and complying with industry regulations. With a substantial volume of documents daily, output management software is essential for document scanning, optical character recognition (OCR), and form processing solutions. This software helps BFSI organizations achieve better security, cost reduction, and improved traceability. Additionally, it facilitates personalized and timely customer communication, enhancing the overall customer experience and satisfaction. Financial institutions require multi-channel document delivery, and output management software enables seamless delivery via preferred channels. JPMorgan Chase and Wells Fargo are prominent users, streamlining document workflows and managing diverse document types. RBC Capital Markets reduced costs by 30% using HP Managed Print Services, addressing challenges like high printing requirements, obsolete devices, and frequent repairs. The BFSI sector’s focus on document security, compliance, digital transformation, efficient document workflows, and cost reduction will fuel the demand for output management software, boosting the BFSI segment’s growth in the market.
Download a Sample of our comprehensive report today to discover how AI-driven innovations are reshaping competitive dynamics
The Output Management Software market is a significant segment of the IT industry, focusing on managing and optimizing the production, delivery, and archiving of various types of business documents. This software plays a crucial role in streamlining document-intensive processes, reducing manual tasks, and enhancing business efficiency. The market caters to various sectors, including the document management, customer relationship management, enterprise resource planning, E Commerce industry, and more. Output Management Software supports multiple formats, including emails, portals, paperwork, and electronic documents. Key applications include printing, personalizing output communications, and ensuring business continuity planning. It is essential for industries dealing with large volumes of paperwork, such as financial services, healthcare, and government, to adopt Output Management Software for sustainable development and cost savings. Moreover, the software supports digital transformation initiatives by enabling seamless integration with Operating Systems and other business applications, ensuring the secure and timely delivery of information to various stakeholders. The market is witnessing significant growth due to the increasing demand for efficient document management, reducing reliance on printed letters, invoices, and other physical documents.
The Output Management Software market encompasses solutions that manage and automate the production and delivery of various forms of business documents, including emails, portals, and printed documents. These systems streamline administrative tasks, such as document management, workflow management, and customer relationship management, in industries like healthcare, education, banking, and IT. Automation of printing tools and the integration with ERP and CRM systems are key features. Cloud-based and on-premises solutions cater to large enterprises and small businesses, offering paperless operations and sustainable development. Services range from document creation to data access and security, including system-generated documents, outsourcing, and compliance with operating systems and software compatibility. Output Management Software supports digital transformation initiatives, enabling personalizing output communications, e-commerce, and business continuity planning. Big data analytics and IoT integration add value, while addressing concerns like data theft and cybersecurity. The market continues to evolve, offering innovative solutions for various industries and use cases.
1 Executive Summary
2 Market Landscape
3 Market Sizing
4 Historic Market Size
5 Five Forces Analysis
6 Market Segmentation
End-userBFSIHealthcareManufacturingOthersDeploymentCloudOn-premisesGeographyNorth AmericaAPACEuropeMiddle East And AfricaSouth America
7 Customer Landscape
8 Geographic Landscape
9 Drivers, Challenges, and Trends
10 Company Landscape
11 Company Analysis
12 Appendix
Technavio is a leading global technology research and advisory company. Their research and analysis focuses on emerging market trends and provides actionable insights to help businesses identify market opportunities and develop effective strategies to optimize their market positions.
With over 500 specialized analysts, Technavio’s report library consists of more than 17,000 reports and counting, covering 800 technologies, spanning across 50 countries. Their client base consists of enterprises of all sizes, including more than 100 Fortune 500 companies. This growing client base relies on Technavio’s comprehensive coverage, extensive research, and actionable market insights to identify opportunities in existing and potential markets and assess their competitive positions within changing market scenarios.
Technavio Research
Jesse Maida
Media & Marketing Executive
US: +1 844 364 1100
UK: +44 203 893 3200
Email: media@technavio.com
Website: www.technavio.com/
View original content to download multimedia:https://www.prnewswire.com/news-releases/output-management-software-market-to-grow-by-usd-10-67-billion-2025-2029-driven-by-healthcare-adoption-and-ai-driven-market-transformation—technavio-302342663.html
SOURCE Technavio

LG Electronics and Samsung Unveil Cutting Edge Shoppable TV Capabilities Powered by TheTake.AI at CES 2025

Reolink Debuts 16MP Wi-Fi Camera & Continuous Recording Battery Cam Series at CES 2025

Output Management Software Market to Grow by USD 10.67 Billion (2025-2029), Driven by Healthcare Adoption and AI-Driven Market Transformation – Technavio

Whiteboard Series with NEAR | Ep: 45 Joel Thorstensson from ceramic.network

Peloton Unveils Holiday 2022 Creative Campaign Highlighting How Motivation Transcends Beyond the Workout

These ’90s fashion trends are making a comeback in 2017

Why You Should Build on #NEAR – Co-founder Illia Polosukhin at CV Labs
Whiteboard Series with NEAR | Ep: 45 Joel Thorstensson from ceramic.network

NEAR End of Year Town Hall 2021: The Open Web World, MetaBUILD 2 Hackathon and 2021 recap
Trending
-

 Technology4 days ago
SandboxAQ Publishes Scientific and Technical Milestones for Cybersecurity
-

 Technology4 days ago
CES 2025: JMGO Showcases the Future of Projectors with AI-Powered ‘Bright, Even in Sunlight’ Innovation
-

 Technology4 days ago
A. O. Smith to Hold Fourth Quarter Conference Call on January 30, 2025
-

 Coin Market4 days ago
Crypto VCs reveal what they’re looking for in 2025
-

 Coin Market4 days ago
Phishing scams top crypto security threat of 2024 — CertiK
-

 Technology4 days ago
Interest-Driven Consumption Sparks ¥ 500B ACG Goods Market, MINISO Rides the Wave
-

 Technology4 days ago
Artronic Design Unveils Komutr, World’s First MagSafe Earbuds at CES 2025
-

 Technology4 days ago
Canela Media Appoints Philippe Guelton as Global President