Connect with us

Technology

Smartwatch Market to Grow by USD 46.3 Billion (2025-2029), Technological Advances in Semiconductor Industry Boosting the Market, with AI Driving Market Transformation – Technavio

Published

on

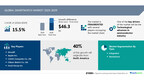
NEW YORK, Jan. 31, 2025 /PRNewswire/ — Report with the AI impact on market trends – The global smartwatch market size is estimated to grow by USD 46.3 billion from 2025-2029, according to Technavio. The market is estimated to grow at a CAGR of 15.5% during the forecast period. Technological advances in semiconductor industry is driving market growth, with a trend towards increasing number of patent filings by smartwatch manufacturers. However, increasing data security and privacy concerns poses a challenge. Key market players include Amazfit, Apple Inc., CASIO Computer Co. Ltd., Citizen Watch Co. Ltd., Fossil Group Inc., Garmin Ltd., Google LLC, HK SMARTMV Ltd., Huawei Technologies Co. Ltd., Imagine Marketing Pvt. Ltd., Kate Spade, LG Corp., LVMH Moet Hennessy Louis Vuitton SE, Polar Electro Oy, Samsung Electronics Co. Ltd., Suunto Oy, Tata Sons Pvt. Ltd., Timex Group, Withings, and Xiaomi Inc..

Key insights into market evolution with AI-powered analysis. Explore trends, segmentation, and growth drivers- View Free Sample PDF

Smartwatch Market Scope

Report Coverage

Details

Base year

2024

Historic period

2019 – 2023

Forecast period

2025-2029

Growth momentum & CAGR

Accelerate at a CAGR of 15.5%

Market growth 2025-2029

USD 46.3 billion

Market structure

Fragmented

YoY growth 2022-2023 (%)

14.6

Regional analysis

North America, APAC, Europe, South America, and Middle East and Africa

Performing market contribution

North America at 40%

Key countries

US, China, Canada, Japan, Brazil, UK, Germany, France, Italy, and Spain

Key companies profiled

Amazfit, Apple Inc., CASIO Computer Co. Ltd., Citizen Watch Co. Ltd., Fossil Group Inc., Garmin Ltd., Google LLC, HK SMARTMV Ltd., Huawei Technologies Co. Ltd., Imagine Marketing Pvt. Ltd., Kate Spade, LG Corp., LVMH Moet Hennessy Louis Vuitton SE, Polar Electro Oy, Samsung Electronics Co. Ltd., Suunto Oy, Tata Sons Pvt. Ltd., Timex Group, Withings, and Xiaomi Inc.

Market Driver

The Smartwatch Market is experiencing significant growth with increasing shipment volumes, driven by urbanization and the millennial population’s preference for wearable technology. Gear Smartwatches and health consciousness are key trends in this sector. Companies like Boat and Xtend are making strides with their Sport smartwatches in the Fitness industry. The Global market is witnessing upgrades with health monitoring features such as Blood oxygen (SpO2) sensors, Stress monitors, and Electrocardiograms (ECG sensors). Price bands vary from basic LCDs to high-end OLED-based smartwatches. Supply chain disruptions have affected some brands, but demand remains strong. Health monitoring smartwatches are popular among older people for real-time health status and fall detection. Businesses like L’Oreal are exploring skin sensors for future applications. The market report covers display technology, operating systems, interfaces, and more. Smartwatches offer features like phone calls, weather reports, music, text messages, digital assistant, and low power consumption. Some models have advanced health monitoring features such as sleep apnea detection, EKG monitor, and glucose monitoring for diabetes patients. 

The smartwatch market is witnessing a significant trend with an increasing number of patent applications being filed. Patents provide exclusive rights for a set period, enabling vendors to prevent others from manufacturing, using, or selling similar inventions. Major players are focusing on obtaining patents for displays, cameras, sensors, and related technologies to incorporate advanced features into next-generation smartwatches. This strategic move allows vendors to differentiate themselves in the competitive global market and gain a competitive edge. 

Request Sample of our comprehensive report now to stay ahead in the AI-driven market evolution!

Market Challenges

The Smartwatch Market is experiencing significant growth with increasing shipment volumes, driven by urbanization and the millennial population’s preference for wearable technology. Gear Smartwatches and health consciousness are key trends, with the Fitness Industry and Health Monitoring Features becoming essential selling points. Boat and Xtend Sport smartwatches lead the market, offering Fitness Tracking and Calorie Counters. The Global Smartwatch Market faces challenges such as Supply Chain Disruptions and Price Bands. OLED-based smartwatches like the Forerunner 945 LTE are upgrading with advanced Health Monitoring Features, including Blood Oxygen and SpO2 Sensors, Stress Monitors, Electrocardiograms, and Fall Detection. Wearable Computing Devices, like Wristwatches, are now Bluetooth-capable, enabling Phone Calls, Weather Reports, Music, Text Messages, and Digital Assistant access. Older people also benefit from Real-time Health Status monitoring, with Fall Detection apps and EKG Monitors addressing specific health concerns, such as Sleep Apnea, Diabetes, and Glucose Monitoring. Businesses like L’Oreal and Skin Sensors are exploring opportunities in this market. Low Power Consumption and High Image Quality are crucial factors, making Wearable Devices a must-have for both personal and professional use.Smartwatches, popular for their convenience and advanced features, have gained significant market traction. However, concerns regarding data security and privacy have emerged due to the devices’ motion sensors, making them susceptible to hacking. These gadgets store and access vast amounts of sensitive data in real-time, including personal information, health data, messages, calls, maps, and financial details. The risk of data breaches is substantial, as hackers can decode this data using wireless interceptors without the user’s knowledge. In response, regulatory bodies are taking action. For instance, Europe’s General Data Protection Regulation mandates secure processing of personal data using appropriate technical and organizational measures. These measures aim to mitigate potential risks and safeguard user privacy.

Discover how AI is revolutionizing market trends- Get your access now!

Segment Overview

This smartwatch market report extensively covers market segmentation by

Type 1.1 Integrated1.2 StandaloneOS 2.1 Android wear2.2 Apple watch OS2.3 Fitbit OS2.4 Tizen OSGeography 3.1 North America3.2 APAC3.3 Europe3.4 South America3.5 Middle East and Africa

1.1 Integrated- Smartwatches with integrated capabilities have gained popularity due to their ability to connect with other computing devices, such as smartphones, via Bluetooth or WiFi technology. This connection enables users to access various smart features, including internet access, messaging, social media notifications, weather updates, and music playback. The market for integrated smartwatches is projected to expand due to the increasing penetration of affordable smartwatches in emerging markets and the entry of traditional watch manufacturers. Companies like Huawei, Xiaomi, and Zepp Health are offering advanced features at reasonable prices, attracting millennials in countries such as India, Brazil, and China. CASIO and Fossil are among the analog and digital watch manufacturers offering integrated smartwatches. The integrated segment is expected to remain the dominant market segment due to its focus on health and fitness features, with several traditional watch manufacturers expected to join during the forecast period.

Download a Sample of our comprehensive report today to discover how AI-driven innovations are reshaping competitive dynamics

Research Analysis

The Smartwatch Market is experiencing significant growth due to the increasing urbanization and the rising demand from millennials for wearable technology. The shipment volume of smartwatches is projected to reach new heights as people become more health-conscious and the fitness industry integrates these devices into their offerings. Fitness tracking and health monitoring features are driving the demand for smartwatches, with advanced technologies such as SpO2 sensors, electrocardiograms, and heart health monitoring becoming increasingly popular. OLED-based smartwatches offer real-time health status updates, including blood oxygen saturation levels and native sleep tracking. Fall detection and diabetes management with glucose monitoring are also gaining traction in the market. Overall, health monitoring smartwatches are revolutionizing the way we manage our health and wellness.

Market Research Overview

The Smartwatch Market is experiencing significant growth, driven by increasing urbanization and the adoption of wearable technology among millennials. The shipment volume of these devices is on the rise, with health consciousness being a major factor. Gear smartwatches, Boat, Xtend Sport smartwatch, and other brands are leading the charge in this sector. The fitness industry is also embracing smartwatches for fitness tracking and health monitoring features, including blood oxygen (SpO2) sensors, stress monitors, and electrocardiograms (ECG). Upgraded smartwatches offer calorie counters, fall detection, native sleep tracking, heart health monitoring, and more. Wearable computing devices, once considered luxury wristwatches, now serve as essential health monitoring tools. Older people and those with specific health conditions, such as sleep apnea, diabetes, and heart issues, also benefit from real-time health status updates. The market report covers supply chain disruptions, price bands, display technology, operating systems, interfaces (UI), and the latest trends in OLED-based smartwatches and LCDs. Smartwatches can now make phone calls, receive weather reports, play music, and send text messages, all wirelessly via Bluetooth or a wireless Bluetooth adaptor. Additionally, digital assistants, low power consumption, and high image quality add to their appeal.

Table of Contents:

1 Executive Summary
2 Market Landscape
3 Market Sizing
4 Historic Market Size
5 Five Forces Analysis
6 Market Segmentation

TypeIntegratedStandaloneOSAndroid WearApple Watch OSFitbit OSTizen OSGeographyNorth AmericaAPACEuropeSouth AmericaMiddle East And Africa

7 Customer Landscape
8 Geographic Landscape
9 Drivers, Challenges, and Trends
10 Company Landscape
11 Company Analysis
12 Appendix

About Technavio

Technavio is a leading global technology research and advisory company. Their research and analysis focuses on emerging market trends and provides actionable insights to help businesses identify market opportunities and develop effective strategies to optimize their market positions.

With over 500 specialized analysts, Technavio’s report library consists of more than 17,000 reports and counting, covering 800 technologies, spanning across 50 countries. Their client base consists of enterprises of all sizes, including more than 100 Fortune 500 companies. This growing client base relies on Technavio’s comprehensive coverage, extensive research, and actionable market insights to identify opportunities in existing and potential markets and assess their competitive positions within changing market scenarios.

Contacts

Technavio Research
Jesse Maida
Media & Marketing Executive
US: +1 844 364 1100
UK: +44 203 893 3200
Email: media@technavio.com
Website: www.technavio.com/

View original content to download multimedia:https://www.prnewswire.com/news-releases/smartwatch-market-to-grow-by-usd-46-3-billion-2025-2029-technological-advances-in-semiconductor-industry-boosting-the-market-with-ai-driving-market-transformation—technavio-302364649.html

SOURCE Technavio

Continue Reading
Click to comment

Leave a Reply

Your email address will not be published. Required fields are marked *

Technology

Socket Mobile Reports Fourth Quarter 2024 and Full Year Results

Published

on

By

FREMONT, Calif., Feb. 25, 2025 /PRNewswire/ — Socket Mobile, Inc. (NASDAQ: SCKT), a leading provider of data capture and delivery solutions for enhanced workplace productivity, today reported financial results that are determined in accordance with generally accepted accounting principles in the United States (“GAAP”) for the three and twelve months ended December 31, 2024.

Fourth Quarter 2024 Financial Highlights: 

Revenue of $4.8 million, a 10% increase compared to $4.4 million in the comparable prior year quarter and a 25% increase sequentially compared to $3.9 million in Q3 2024.

Gross margin of 51.0% compared with 52.8% in the prior year quarter and 49.0% in the preceding quarter.

Operating loss was $411,000 compared to an operating loss of $476,000 a year ago and an operating loss of $1,031,000 in the preceding quarter.

Diluted earnings per share of $0.00 compared to diluted earnings per share of $0.08 a year ago and a net loss per share of ($0.15) in the prior quarter.

Full Year 2024 Financial Highlights:

Revenue for the full year of 2024 was $18.8 million versus $17.0 million in 2023, an increase of 10.2% year-over-year.

Gross margin for 2024 was 50.4% compared to 49.7% in 2023.

Operating loss was $2.5 million in 2024 compared to operating loss of $3.1 million in 2023.

Net loss per share of ($0.30), compared to a net loss per share of ($0.27) in the prior year.

“Our financial performance in both Q4 and 2024 improved compared to 2023, driven by the growth of our business serving retail POS application providers. Adoption in the warehousing and logistics sectors is taking longer than expected. Through our evaluation, we’ve identified key areas for improvement and are taking steps to strengthen our position,” said Kevin Mills, President, and Chief Executive Officer.

“In 2024, we focused on expanding our market presence with the launch of several new products. The XtremeScan product family grew with the introduction of XtremeScan Mag devices—XS630, XS640, XG630, and XG640—designed for the increasing number of workers who use a single phone for both personal and business needs. The Bring Your Own Device (BYOD) category represents a significant yet underserved market where we see strong growth potential. The BYOD XtremeScan products are complementary to the Xtreme version and use dedicated iPhones.

Additionally, we introduced the S320, our first countertop QR Code Payment Reader, offering a versatile solution for retail POS application providers. Beyond QR Code payment processing, the S320 supports age verification, access control, ticket validation, loyalty programs, and couponing. We also updated our CaptureSDK and our entire line of barcode scanners and NFC reader/writers to be fully compatible with iOS 18,” continued Mr. Mills.

“As part of our ongoing efforts to enhance customer engagement, we launched a new website and an updated developer portal, Alfred—an AI-powered tool that provides CaptureSDK developers with 24/7 multilingual support. The improved platform offers streamlined navigation and content, making it easier for users to access resources and explore our full range of solutions.”

“Looking ahead, we remain committed to innovation, expanding our product offerings, and strengthening our market position. By improving our technology and customer support, we are building a solid foundation for the future. We appreciate the support of our customers and partners as we move forward,” concluded Mills.

Conference Call
The management of Socket Mobile will hold a conference call today at 2 P.M. Pacific (5 P.M. Eastern) to discuss the quarterly and year-end results and outlook for the future. The dial-in number to access the live conference call is (800) 237-1091, toll-free from within the U.S., or (848) 488-9280 (toll).

About Socket Mobile, Inc.   
Socket Mobile is a leading provider of data capture and delivery solutions for enhanced productivity in workforce mobilization. Socket Mobile’s revenue is primarily driven by the deployment of third-party barcode-enabled mobile applications that integrate Socket Mobile’s cordless barcode scanners and contactless readers/writers. Mobile Applications servicing the specialty retailer, field service, digital ID, transportation, and manufacturing markets are the primary revenue drivers. Socket Mobile has a network of thousands of developers who use its software developer tools to add sophisticated data capture to their mobile applications. Socket Mobile is headquartered in Fremont, Calif., and can be reached at +1-510-933-3000 or www.socketmobile.com. Follow Socket Mobile on LinkedIn, X, and keep up with our latest News and Updates.

Forward-Looking Statements 
This press release contains forward-looking statements within the meaning of Section 27A of the Securities Act of 1933, as amended, and Section 21E of the Securities Exchange Act of 1934, as amended. Such forward-looking statements include, but are not limited to, statements regarding new mobile computers and data collection products, including details on the timing, distribution, and market acceptance of the products, and statements predicting trends, sales, market conditions, and opportunities in the markets in which we sell our products. Such statements involve risks and uncertainties, and actual results could differ materially from the results anticipated in such forward-looking statements as a result of a number of factors, including, but not limited to, the risk that our new products may be delayed or not rollout as predicted, if ever, due to technological, market, or financial factors, including the availability of necessary working capital, the risk that market acceptance and sales opportunities may not happen as anticipated, the risk that our application partners and current distribution channels may choose not to distribute the new products or may not be successful in doing so, the risk that acceptance of our new products in vertical application markets may not happen as anticipated, and other risks described in our most recent Form 10-K and 10-Q reports filed with the Securities and Exchange Commission.

Socket Mobile Investor Contact:
Lynn Zhao
Chief Financial Officer
510-933-3016
lynn@socketmobile.com

Socket is a registered trademark of Socket Mobile. All other trademarks and trade names contained herein may be those of their respective owners.

© 2025, Socket Mobile, Inc. All rights reserved.

–      Financial tables to follow –


Socket Mobile, Inc.
Condensed Summary Statements of Operations
(Amounts in thousands except per share amounts)

Year ended Dec 31,

Three months ended Dec 31,

(Unaudited)
2024

 2023*

(Unaudited)
2024

 2023*

Revenue

$ 18,763

$ 17,034

$    4,831

$    4,398

Cost of revenue

9,311

8,571

2,366

2,078

Gross profit

9,452

8,463

2,465

2,320

   Gross profit percent

50.4 %

49.7 %

51.0 %

52.8 %

Research & development

4,721

4,832

1,119

1,188

Sales & marketing

4,414

4,016

1,106

1,003

General & administrative

2,779

2,736

651

605

   Total operating expenses

11,914

11,584

2,876

2,796

Operating income (loss)

(2,462)

(3,121)

(411)

(476)

Interest expense

(331)

(242)

(102)

(72)

Loss before income taxes

(2,793)

(3,363)

(513)

(548)

Deferred income tax benefit (expense)

551

1,444

551

1,460

Net income (loss)

$  (2,242)

$    (1,919)

$        38

$         912

Net income (loss) per share:

   Basic

$    (0.30)

$     (0.27)

$     0.00

$       0.11

   Fully diluted

$    (0.30)

$     (0.27)

$     0.00

$       0.08

Weighted average shares outstanding:

   Basic

   Fully diluted


 7,558

 7,558


7,230

7,230


  7,605

  7,703


  7,327

          9,486

*Derived from audited financial statements. 


Socket Mobile, Inc.
Condensed Summary Balance Sheets
(Amounts in Thousands)

 (Unaudited)
December 31, 2024


December 31,
2023*

Cash

$        2,492

$     2,827

Accounts receivable

1,588

1,700

Inventories

4,942

5,409

Deferred costs on shipments to distributors

Other current assets

           143

           431

              323

              441

Property and equipment, net

2,787

3,033

Deferred tax assets

10,663

10,112

Intangible assets, net

1,432

1,559

Operating leases right-of-use assets

2,604

3,088

Other long-term assets

264

250

Total assets

$      27,346

$   28,742

Accounts payable and accrued liabilities

$        1,977

$     2,185

Subordinated convertible notes payable, net of discount

150

150

Subordinated convertible notes payable, net of discount-related party

3,818

2,836

Deferred revenue on shipments to distributors

392

826

Deferred service revenue

31

33

Operating lease liabilities

2,817

3,292

Total liabilities

9,185

9,322

Common stock

69,374

68,391

Accumulated deficit

(50,175)

(47,933)

Treasury stock

(1,038)

(1,038)

Total equity

18,161

19,420

Total liabilities and equity

$      27,346

$ 28,742

*Derived from audited financial statements. 


View original content to download multimedia:https://www.prnewswire.com/news-releases/socket-mobile-reports-fourth-quarter-2024-and-full-year-results-302385101.html

SOURCE Socket Mobile, Inc.

Continue Reading

Technology

MATSON, INC. ANNOUNCES FOURTH QUARTER AND FULL YEAR 2024 RESULTS; PROVIDES 2025 OUTLOOK

Published

on

By

4Q24 EPS of $3.80Full Year 2024 EPS of $13.93Full Year 2024 Net Income and EBITDA of $476.4 million and $738.9 million, respectively1Q25 Consolidated Operating income expected to be meaningfully higher year-over-year2025 Consolidated Operating Income dependent on timing of Red Sea normalization and other factors

HONOLULU, Feb. 25, 2025 /PRNewswire/ — Matson, Inc. (“Matson” or the “Company”) (NYSE: MATX), a leading U.S. carrier in the Pacific, today reported net income of $128.0 million, or $3.80 per diluted share, for the quarter ended December 31, 2024. Net income for the quarter ended December 31, 2023 was $62.4 million, or $1.78 per diluted share. Consolidated revenue for the fourth quarter 2024 was $890.3 million compared with $788.9 million for the fourth quarter 2023.

“Matson had a very strong fourth quarter that exceeded our expectations, capping off a strong year. For the quarter, our China service was the primary driver of the year-over-year increase in Ocean Transportation and consolidated operating income. We saw seasonally stronger freight demand with significantly higher year-over-year freight rates for our industry-leading CLX and MAX services. In Logistics, operating income increased year-over-year primarily due to a higher contribution from supply chain management. For the full year 2024, our consolidated operating income increased year-over-year primarily driven by significantly higher freight rates in our China service. The higher freight rates, which started in the middle of the second quarter and remained through year end, were supported by a resilient U.S. economy and a stable consumer demand environment coupled with tighter supply chain conditions.”

Mr. Cox added, “Looking ahead, we expect elevated freight rates in our China service to continue into the first quarter 2025. Beyond the first quarter, our China service rates will largely be driven by the timing of trade flow normalization in the Red Sea, other geopolitical factors, supply chain activity and the trajectory of the U.S. economy. With respect to the Red Sea, assuming trade conditions normalize by the middle of the year, we expect freight rates in our China service to moderate in the second half of the year. However, if the Red Sea remains disrupted through year end, we expect our freight rates in China to remain elevated throughout the year. For our domestic tradelanes in 2025, we expect volume in Guam to be modestly higher than the levels achieved in 2024 and volume in Hawaii and Alaska to approximate the levels achieved in 2024. For Logistics in 2025, we expect modestly lower operating income due to challenging business conditions for transportation brokerage and a lower contribution from supply chain management.” 

“As a result, for the first quarter 2025, we expect Matson’s consolidated operating income to be meaningfully higher than the level achieved in the same period last year. We expect full year 2025 consolidated operating income to be largely driven by the timing of trade flow normalization in the Red Sea, other geopolitical factors, supply chain activity and the trajectory of the U.S. economy. Assuming trade conditions in the Red Sea normalize by the middle of the year and there are no significant changes from today in the other factors referenced above, we expect full year 2025 consolidated operating income to be moderately lower than the level achieved last year. However, if trade conditions in the Red Sea remain disrupted through year end and there are no significant changes from today in the other factors noted above, we expect our full year 2025 consolidated operating income to approach the level achieved in 2024.”

Fourth Quarter 2024 Discussion and Outlook for 2025

Ocean Transportation: The Company’s container volume in the Hawaii service in the fourth quarter 2024 was 1.7 percent lower year-over-year. The decrease was primarily due to lower general demand. Hawaii’s economy is expected to continue to grow slowly supported by modest gains in tourism, a low unemployment rate, and increased construction activity, but partially restrained by continued challenges in population growth and lower discretionary income as a result of high inflation and interest rates. The Company expects volume in 2025 to be comparable to the level achieved in 2024, reflecting modest economic growth in Hawaii and stable market share.

In China, the Company achieved significantly higher freight rates in the fourth quarter 2024 compared to the year ago period. The Company’s container volume in the fourth quarter 2024 also increased 7.2 percent year-over-year due to seasonally stronger freight demand. The elevated freight rates in the fourth quarter 2024 were supported by a resilient U.S. economy and a stable consumer demand environment coupled with tighter supply chain conditions. The Company expects elevated freight rates to continue into the first quarter 2025. Beyond the first quarter, the Company expects freight rates will largely be driven by the timing of trade flow normalization in the Red Sea, other geopolitical factors, supply chain activity and the trajectory of the U.S. economy. With respect to the Red Sea, assuming trade conditions normalize by the middle of the year, the Company expects freight rates to moderate in the second half of the year. However, if the Red Sea remains disrupted through year end, the Company expects freight rates to remain elevated throughout the year.

In Guam, the Company’s container volume in the fourth quarter 2024 decreased 10.0 percent year-over-year. The decrease was primarily due to lower demand from retail and food and beverage segments. In the near term, the Company expects Guam’s economy to grow modestly supported by a low unemployment rate and an increase in construction activity. For the full year 2025, the Company expects volume to be modestly higher than the level achieved last year.

In Alaska, the Company’s container volume for the fourth quarter 2024 increased 1.1 percent year-over-year. The increase was primarily due to higher northbound volume, partially offset by an additional sailing in the year ago period. In the near term, the Company expects continued economic growth in Alaska supported by a low unemployment rate, jobs growth and continued oil and gas exploration and production activity. For the full year 2025, the Company expects volume to approximate the level achieved last year.

The loss in the fourth quarter 2024 from the Company’s SSAT joint venture investment was $9.5 million, or $13.6 million lower than the income of $4.1 million in fourth quarter 2023. The decrease was due to a $18.4 million impairment charge related to the write-down of a terminal operating lease asset, partially offset by higher year-over-year lift volume. On an after-tax basis, the impairment charge impacted fourth quarter 2024 net income and diluted EPS by $14.0 million and $0.42 per share, respectively. For 2025, the Company expects the contribution from SSAT to approximate the level achieved in 2024, without taking into account the $18.4 million impairment charge in the fourth quarter 2024.

Based on the outlook trends noted above, the Company expects Ocean Transportation operating income for the first quarter 2025 to be meaningfully higher than the $27.6 million achieved in the first quarter 2024. For full year 2025, the Company expects Ocean Transportation operating income to be largely driven by the timing of trade flow normalization in the Red Sea, other geopolitical factors, supply chain activity and the trajectory of the U.S. economy. Assuming trade conditions in the Red Sea normalize by the middle of the year and there are no significant changes from today in the other factors referenced above, the Company expects full year 2025 Ocean Transportation operating income to be moderately lower than the $500.9 million achieved in 2024. However, if trade conditions in the Red Sea remain disrupted through year end and there are no significant changes from today in the other factors noted above, the Company expects full year 2025 Ocean Transportation operating income to approach the level achieved in 2024. 

Logistics: In the fourth quarter 2024, operating income for the Company’s Logistics segment was $10.1 million, or $1.2 million higher compared to the level achieved in the fourth quarter 2023. The increase was primarily due to a higher contribution from supply chain management. For 2025, the Company expects challenging business conditions for transportation brokerage for most of the year and a lower contribution from supply chain management, which the Company expects to lead to modestly lower operating income compared to the level achieved in 2024. For the first quarter 2025, the Company expects Logistics operating income to be modestly lower than the $9.3 million achieved in the first quarter 2024.

Consolidated Operating Income: For the first quarter 2025, the Company expects consolidated operating income to be meaningfully higher than the $36.9 million achieved in the first quarter 2024. For full year 2025, the Company expects consolidated operating income to be largely driven by the timing of trade flow normalization in the Red Sea, other geopolitical factors, supply chain activity and the trajectory of the U.S. economy. Assuming trade conditions in the Red Sea normalize by the end of the first half of the year and there are no significant changes from today in the other factors referenced above, the Company expects full year 2025 consolidated operating income to be moderately lower than the $551.3 million achieved in 2024. However, if trade conditions in the Red Sea remain disrupted through year end and there are no significant changes from today in the other factors noted above, the Company expects full year 2025 consolidated operating income to approach the level achieved in 2024.

Depreciation and Amortization: For full year 2025, the Company expects depreciation and amortization expense to be approximately $200 million, inclusive of dry-docking amortization of approximately $26 million.

Interest Income: The Company expects interest income for the full year 2025 to be approximately $31 million.

Interest Expense: The Company expects interest expense for the full year 2025 to be approximately $7 million.

Other Income (Expense): The Company expects full year 2025 other income (expense) to be approximately $9 million in income, which is attributable to the amortization of certain components of net periodic benefit costs or gains related to the Company’s pension and post-retirement plans.

Income Taxes: In the fourth quarter 2024, the Company’s effective tax rate was 19.1 percent. For the full year 2025, the Company expects its effective tax rate to be approximately 22.0 percent.

Capital and Vessel Dry-docking Expenditures: For the full year 2024, the Company made capital expenditure payments excluding new vessel construction expenditures of $214.5 million, new vessel construction expenditures (including capitalized interest and owner’s items) of $95.6 million, and dry-docking payments of $30.2 million. For the full year 2025, the Company expects to make other capital expenditure payments, including maintenance capital expenditures, of approximately $120 to $140 million, new vessel construction expenditures (including capitalized interest and owner’s items) of approximately $305 million, and dry-docking payments of approximately $40 million.

Results By Segment

Ocean Transportation — Three months ended December 31, 2024 compared with 2023

Three Months Ended December 31, 

(Dollars in millions)

2024

2023

Change

Ocean Transportation revenue

$

742.1

$

639.7

$

102.4

16.0

%

Operating costs and expenses

(604.7)

(573.3)

(31.4)

5.5

%

Operating income

$

137.4

$

66.4

$

71.0

106.9

%

Operating income margin

18.5

%

10.4

%

Volume (Forty-foot equivalent units (FEU), except for automobiles) (1)

Hawaii containers

34,800

35,400

(600)

(1.7)

%

Hawaii automobiles

7,000

10,100

(3,100)

(30.7)

%

Alaska containers

18,000

17,800

200

1.1

%

China containers

37,400

34,900

2,500

7.2

%

Guam containers

4,500

5,000

(500)

(10.0)

%

Other containers (2)

4,300

4,700

(400)

(8.5)

%

(1)

Approximate volume included for the period are based on the voyage departure date, but revenue and operating income are adjusted to reflect the percentage of revenue and operating income earned during the reporting period for voyages in transit at the end of each reporting period.

(2)

Includes containers from services in various islands in Micronesia and the South Pacific, and Okinawa, Japan.


Ocean Transportation revenue increased $102.4 million, or 16.0 percent, during the three months ended December 31, 2024, compared with the three months ended December 31, 2023. The increase was primarily due to significantly higher freight rates in China and higher volume in China.

On a year-over-year FEU basis, Hawaii container volume decreased 1.7 percent primarily due to lower general demand; Alaska volume increased 1.1 percent primarily due to higher northbound volume, partially offset by an additional sailing in the year ago period; China volume was 7.2 percent higher due to seasonally stronger freight demand; Guam volume decreased 10.0 percent primarily due to lower demand from retail and food and beverage segments; and Other containers volume decreased 8.5 percent.

Ocean Transportation operating income increased $71.0 million, or 106.9 percent, during the three months ended December 31, 2024, compared with the three months ended December 31, 2023. The increase was primarily due to significantly higher freight rates in China, the timing of fuel-related surcharge collections, and higher volume in China, partially offset by a lower contribution from SSAT and higher direct cargo expense (primarily in the China service) and general and administrative expenses.

The Company’s SSAT terminal joint venture investment incurred a loss of $9.5 million during the three months ended December 31, 2024, compared to income of $4.1 million during the three months ended December 31, 2023. The decrease was due to a $18.4 million impairment charge related to the write-down of a terminal operating lease asset, partially offset by higher year-over-year lift volume.

Ocean Transportation — Year ended December 31, 2024 compared with 2023

Years Ended December 31, 

(Dollars in millions)

2024

2023

Change

Ocean Transportation revenue

$

2,809.7

$

2,477.0

$

332.7

13.4

%

Operating costs and expenses

(2,308.8)

(2,182.2)

(126.6)

5.8

%

Operating income

$

500.9

$

294.8

$

206.1

69.9

%

Operating income margin

17.8

%

11.9

%

Volume (Forty-foot equivalent units (FEU), except for automobiles) (1)

Hawaii containers

140,700

144,000

(3,300)

(2.3)

%

Hawaii automobiles

30,400

39,400

(9,000)

(22.8)

%

Alaska containers

80,500

80,000

500

0.6

%

China containers

144,100

140,700

3,400

2.4

%

Guam containers

18,800

20,100

(1,300)

(6.5)

%

Other containers (2)

17,000

17,500

(500)

(2.9)

%

(1)

Approximate volume included for the period are based on the voyage departure date, but revenue and operating income are adjusted to reflect the percentage of revenue and operating income earned during the reporting period for voyages in transit at the end of each reporting period.

(2)

Includes containers from services in various islands in Micronesia and the South Pacific, and Okinawa, Japan.


Ocean Transportation revenue increased $332.7 million, or 13.4 percent, during the year ended December 31, 2024, compared with the year ended December 31, 2023. The increase was primarily due to significantly higher freight rates in China, higher freight rates in the domestic tradelanes, and higher volume in China, partially offset by lower domestic tradelane volume.

On a year-over-year FEU basis, Hawaii container volume decreased 2.3 percent primarily due to lower general demand; Alaska volume increased 0.6 percent due to higher general demand, partially offset by one less northbound sailing; China volume increased 2.4 percent due to stronger seasonal volume in the fourth quarter 2024 and one additional sailing; Guam volume decreased 6.5 percent primarily due to lower general demand; and Other containers volume decreased 2.9 percent.

Ocean Transportation operating income increased $206.1 million, or 69.9 percent, during the year ended December 31, 2024, compared with the year ended December 31, 2023. The increase was primarily due to significantly higher freight rates in China, higher freight rates in the domestic tradelanes, and higher volume in China, partially offset by higher operating costs and general and administrative expenses.

The Company’s SSAT terminal joint venture investment incurred a loss of $1.0 million during the year ended December 31, 2024, compared to income of $2.2 million during the year ended December 31, 2023. The decrease was due to an impairment charge related to the write-down of a terminal operating lease asset in the fourth quarter 2024 of $18.4 million, partially offset by higher lift volume.

Logistics — Three months ended December 31, 2024 compared with 2023

Three Months Ended December 31, 

(Dollars in millions)

2024

2023

Change

Logistics revenue

$

148.2

$

149.2

$

(1.0)

(0.7)

%

Operating costs and expenses

(138.1)

(140.3)

2.2

(1.6)

%

Operating income

$

10.1

$

8.9

$

1.2

13.5

%

Operating income margin

6.8

%

6.0

%


Logistics revenue decreased $1.0 million, or 0.7 percent, during the three months ended December 31, 2024, compared with the three months ended December 31, 2023. The decrease was primarily due to lower revenue in transportation brokerage, partially offset by higher revenue in supply chain management.

Logistics operating income increased $1.2 million, or 13.5 percent, during the three months ended December 31, 2024, compared with the three months ended December 31, 2023. The increase was primarily due to a higher contribution from supply chain management.

Logistics — Year ended December 31, 2024 compared with 2023

Years Ended December 31, 

(Dollars in millions)

2024

2023

Change

Logistics revenue

$

612.1

$

617.6

$

(5.5)

(0.9)

%

Operating costs and expenses

(561.7)

(569.6)

7.9

(1.4)

%

Operating income

$

50.4

$

48.0

$

2.4

5.0

%

Operating income margin

8.2

%

7.8

%


Logistics revenue decreased $5.5 million, or 0.9 percent, during the year ended December 31, 2024, compared with the year ended December 31, 2023. The decrease was primarily due to lower revenue in transportation brokerage, partially offset by higher revenue in supply chain management.

Logistics operating income increased $2.4 million, or 5.0 percent, during the year ended December 31, 2024, compared with the year ended December 31, 2023. The increase was primarily due to a higher contribution from supply chain management.

Liquidity, Cash Flows and Capital Allocation

Matson’s Cash and Cash Equivalents increased by $132.8 million from $134.0 million at December 31, 2023 to $266.8 million at December 31, 2024. As of December 31, 2024, there was $642.6 million of cash and cash equivalents and investments in fixed-rate U.S. Treasuries in the Capital Construction Fund. Matson generated net cash from operating activities of $767.8 million during the year ended December 31, 2024, compared to $510.5 million during the year ended December 31, 2023. Capital expenditures (including capitalized vessel construction expenditures) totaled $310.1 million for the year ended December 31, 2024, compared with $248.4 million for the year ended December 31, 2023. Total debt decreased by $39.7 million during the year to $400.9 million as of December 31, 2024, of which $361.2 million was classified as long-term debt.1 As of December 31, 2024, Matson had available borrowings under its revolving credit facility of $643.9 million.

During the fourth quarter 2024, Matson repurchased approximately 0.2 million shares for a total cost of $31.8 million. As of December 31, 2024, there were approximately 0.8 million shares remaining in the Company’s share repurchase program. For the full year 2024, Matson repurchased approximately 1.6 million shares for a total cost of $201.0 million. Matson’s Board of Directors also declared a cash dividend of $0.34 per share payable on March 6, 2025 to all shareholders of record as of the close of business on February 6, 2025.

1 Total debt is presented before any reduction for deferred loan fees as required by GAAP.


Teleconference and Webcast

A conference call is scheduled on February 25, 2025 at 4:30 p.m. ET when Matt Cox, Chairman and Chief Executive Officer, and Joel Wine, Executive Vice President and Chief Financial Officer, will discuss Matson’s fourth quarter and full year results.

Date of Conference Call:

Tuesday, February 25, 2025

Scheduled Time:

4:30 p.m. ET / 1:30 p.m. PT / 11:30 a.m. HT


The conference call will be broadcast live along with an additional slide presentation on the Company’s website at www.matson.com, under Investors. 

Participants may register for the conference call at:

https://register.vevent.com/register/BI0b3e3bfd4fb54811a8a455a99c38160a

Registered participants will receive the conference call dial-in number and a unique PIN code to access the live event. While not required, it is recommended you join 10 minutes prior to the event starting time. A replay of the conference call will be available approximately two hours after the event by accessing the webcast link at www.matson.com, under Investors.

About the Company

Founded in 1882, Matson (NYSE: MATX) is a leading provider of ocean transportation and logistics services. Matson provides a vital lifeline of ocean freight transportation services to the domestic non-contiguous economies of Hawaii, Alaska, and Guam, and to other island economies in Micronesia. Matson also operates premium, expedited services from China to Long Beach, California, provides service to Okinawa, Japan and various islands in the South Pacific, and operates an international export service from Alaska to Asia. The Company’s fleet of owned and chartered vessels includes containerships, combination container and roll-on/roll-off ships and custom-designed barges. Matson Logistics, established in 1987, extends the geographic reach of Matson’s transportation network throughout North America and Asia. Its integrated, asset-light logistics services include rail intermodal, highway brokerage, warehousing, freight consolidation, supply chain management, and freight forwarding to Alaska. Additional information about the Company is available at www.matson.com.

GAAP to Non-GAAP Reconciliation

This press release, the Form 8-K and the information to be discussed in the conference call include non-GAAP measures. While Matson reports financial results in accordance with U.S. generally accepted accounting principles (“GAAP”), the Company also considers other non-GAAP measures to evaluate performance, make day-to-day operating decisions, help investors understand our ability to incur and service debt and to make capital expenditures, and to understand period-over-period operating results separate and apart from items that may, or could, have a disproportional positive or negative impact on results in any particular period. These non-GAAP measures include, but are not limited to, Earnings Before Interest, Income Taxes, Depreciation and Amortization (“EBITDA”).

Forward-Looking Statements

Statements in this news release that are not historical facts are “forward-looking statements,” within the meaning of the Private Securities Litigation Reform Act of 1995, including without limitation those statements regarding outlook; operating income; depreciation and amortization, including dry-docking amortization; interest income; interest expense; other income (expense); tax rate; capital and vessel dry-docking expenditures; volume, freight rates and demand; trade flow normalization in the Red Sea; geopolitical factors; tariffs and trade; trajectory of the U.S. economy; business conditions for transportation brokerage; contributions from supply chain management; economic growth and drivers in Hawaii, Alaska and Guam; population growth; discretionary income; interest rates; tourism levels; unemployment rates; construction activity; jobs growth; inflation; oil and gas exploration and production activity; contribution from SSAT; impairment charge at SSAT; vessel transit times; refleeting initiatives; timing and amount of milestone payments and related costs; delivery dates for new vessels; and the timing, manner and volume of repurchases of common stock pursuant to the repurchase program. These statements involve a number of risks and uncertainties that could cause actual results to differ materially from those contemplated by the relevant forward-looking statement, including but not limited to risks and uncertainties relating to repeal, substantial amendment or waiver of the Jones Act or changes in its application, or the Company were determined not to be a United States citizen under the Jones Act; changes in macroeconomic conditions, geopolitical developments, or governmental policies; our ability to offer a differentiated service in China for which customers are willing to pay a significant premium; new or increased competition; our relationship with customers and vendors and changes in related agreements; fuel prices, our ability to collect fuel-related surcharges and/or the cost or limited availability of required fuels; evolving regulations and stakeholder expectations related to sustainability matters; timely or successful completion of fleet upgrade initiatives; the Company’s vessel construction agreements with Philly Shipyard; the occurrence of weather, natural disasters, maritime accidents, spill events and other physical and operating risks; transitional and other risks arising from climate change; actual or threatened health epidemics, outbreaks of disease, pandemics or other major health crises; significant operating agreements and leases that may not be renewed/replaced on favorable or acceptable terms; any unanticipated dry-docking or repair costs; joint venture relationships; conducting business in foreign shipping markets, including the imposition of tariffs or a change in international trade policies; any delays or cost overruns related to the modernization of terminals; war, actual or threatened terrorist attacks, efforts to combat terrorism and other acts of violence; consummating and integrating acquisitions; work stoppages or other labor disruptions caused by our unionized workers and other workers or their unions in related industries; loss of key personnel or failure to adequately manage human capital; the use of our information technology and communication systems and cybersecurity attacks; changes in our credit profile, disruptions of the credit markets, changes in interest rates and our future financial performance; our ability to access the debt capital markets; continuation of the Title XI and CCF programs; costs to comply with and liability related to numerous safety, environmental, and other laws and regulations; and disputes, legal and other proceedings and government inquiries or investigations. These forward-looking statements are not guarantees of future performance. This release should be read in conjunction with our Annual Report on Form 10-K for the year ended December 31, 2023 and our other filings with the SEC through the date of this release, which identify important factors that could affect the forward-looking statements in this release. We do not undertake any obligation to update our forward-looking statements.

MATSON, INC. AND SUBSIDIARIES

Condensed Consolidated Statements of Income

(Unaudited)

Three Months Ended

Years Ended

December 31, 

December 31, 

(In millions, except per share amounts)

2024

2023

2024

2023

Operating Revenue:

Ocean Transportation

$

742.1

$

639.7

$

2,809.7

$

2,477.0

Logistics

148.2

149.2

612.1

617.6

Total Operating Revenue

890.3

788.9

3,421.8

3,094.6

Costs and Expenses:

Operating costs

(652.5)

(644.4)

(2,565.9)

(2,470.7)

(Loss) Income from SSAT

(9.5)

4.1

(1.0)

2.2

Selling, general and administrative

(80.8)

(73.3)

(303.6)

(283.3)

Total Costs and Expenses

(742.8)

(713.6)

(2,870.5)

(2,751.8)

Operating Income

147.5

75.3

551.3

342.8

Interest income

10.3

9.8

48.3

36.0

Interest expense

(1.4)

(2.4)

(7.5)

(12.2)

Other income (expense), net

1.8

1.6

7.3

6.4

Income before Taxes

158.2

84.3

599.4

373.0

Income taxes

(30.2)

(21.9)

(123.0)

(75.9)

Net Income

$

128.0

$

62.4

$

476.4

$

297.1

Basic Earnings Per Share

$

3.87

$

1.80

$

14.14

$

8.42

Diluted Earnings Per Share

$

3.80

$

1.78

$

13.93

$

8.32

Weighted Average Number of Shares Outstanding:

Basic

33.1

34.7

33.7

35.3

Diluted

33.7

35.1

34.2

35.7


MATSON, INC. AND SUBSIDIARIES

Condensed Consolidated Balance Sheets

(Unaudited)

December 31, 

December 31, 

(In millions)

2024

2023

ASSETS

Current Assets:

Cash and cash equivalents

$

266.8

$

134.0

Other current assets

342.8

468.3

Total current assets

609.6

602.3

Long-term Assets:

Investment in SSAT

84.1

85.5

Property and equipment, net

2,260.9

2,089.9

Goodwill

327.8

327.8

Intangible assets, net

159.4

176.4

Capital Construction Fund

642.6

599.4

Other long-term assets

511.0

413.3

Total long-term assets

3,985.8

3,692.3

Total assets

$

4,595.4

$

4,294.6

LIABILITIES AND SHAREHOLDERS’ EQUITY

Current Liabilities:

Current portion of debt

$

39.7

$

39.7

Other current liabilities

520.7

522.6

Total current liabilities

560.4

562.3

Long-term Liabilities:

Long-term debt, net of deferred loan fees

350.8

389.3

Deferred income taxes

693.4

669.3

Other long-term liabilities

338.8

273.0

Total long-term liabilities

1,383.0

1,331.6

Total shareholders’ equity

2,652.0

2,400.7

Total liabilities and shareholders’ equity

$

4,595.4

$

4,294.6


MATSON, INC. AND SUBSIDIARIES

Condensed Consolidated Statements of Cash Flows

(Unaudited)

Years Ended December 31, 

(In millions)

2024

2023

2022

Cash Flows From Operating Activities:

Net income

$

476.4

$

297.1

$

1,063.9

Reconciling adjustments:

Depreciation and amortization

153.1

142.2

139.2

Amortization of operating lease right of use assets

133.7

142.0

153.0

Deferred income taxes

20.9

19.6

90.2

(Gain) Loss on disposal of property and equipment

(2.3)

0.6

(1.5)

Share-based compensation expense

26.5

23.8

18.3

Loss (Income) from SSAT

1.0

(2.2)

(83.1)

Distributions from SSAT

14.0

47.3

Other

(10.3)

(0.5)

2.1

Changes in assets and liabilities:

Accounts receivable, net

9.8

(10.9)

74.6

Deferred dry-docking payments

(30.2)

(24.1)

(25.7)

Deferred dry-docking amortization

27.2

25.3

24.9

Prepaid expenses and other assets

94.8

33.5

(45.2)

Accounts payable, accruals and other liabilities

(5.6)

10.9

(31.7)

Operating lease assets and liabilities, net

(139.5)

(144.8)

(154.1)

Other long-term liabilities

(1.7)

(2.0)

(0.3)

Net cash provided by operating activities

767.8

510.5

1,271.9

Cash Flows From Investing Activities:

Capitalized vessel construction expenditures

(95.6)

(52.9)

(62.4)

Capital expenditures (excluding vessel construction expenditures)

(214.5)

(195.5)

(146.9)

Proceeds from disposal of property and equipment, net

5.9

1.2

1.2

Payments for asset acquisitions

(0.8)

(12.4)

(3.0)

Cash and interest deposits into Capital Construction Fund

(120.7)

(128.5)

(582.8)

Withdrawals from Capital Construction Fund

89.6

49.9

64.6

Net cash used in investing activities

(336.1)

(338.2)

(729.3)

Cash Flows From Financing Activities:

Repayments of debt

(39.7)

(76.9)

(111.5)

Dividends paid

(44.8)

(45.0)

(48.0)

Repurchase of Matson common stock

(199.1)

(155.2)

(397.0)

Tax withholding related to net share settlements of restricted stock units

(17.6)

(12.6)

(20.1)

Net cash used in financing activities

(301.2)

(289.7)

(576.6)

Net Increase (Decrease) in Cash, Cash Equivalents and Restricted Cash

130.5

(117.4)

(34.0)

Cash, Cash Equivalents and Restricted Cash, Beginning of the Year

136.3

253.7

287.7

Cash, Cash Equivalents and Restricted Cash, End of the Year

$

266.8

$

136.3

$

253.7

Reconciliation of Cash, Cash Equivalents, and Restricted Cash, at End of the Year:

Cash and Cash Equivalents

$

266.8

$

134.0

$

249.8

Restricted Cash

2.3

3.9

Total Cash, Cash Equivalents and Restricted Cash, End of the Year

$

266.8

$

136.3

$

253.7

Supplemental Cash Flow Information:

Interest paid, net of capitalized interest

$

5.9

$

11.1

$

16.2

Income tax paid, net of income tax refunds

$

(26.5)

$

7.5

$

215.2

Non-cash Information:

Capital expenditures included in accounts payable, accruals and other liabilities

$

7.9

$

10.8

$

5.5

Non-cash payments for intangible asset acquisitions

$

$

2.7

$

2.2


MATSON, INC. AND SUBSIDIARIES

Net Income to EBITDA Reconciliations

(Unaudited)

Three Months Ended

December 31, 

(In millions)

2024

2023

Change

Net Income

$

128.0

$

62.4

$

65.6

Subtract:

Interest income

(10.3)

(9.8)

(0.5)

Add:

Interest expense

1.4

2.4

(1.0)

Add:

Income taxes

30.2

21.9

8.3

Add:

Depreciation and amortization

39.7

35.8

3.9

Add:

Dry-dock amortization

6.2

6.7

(0.5)

EBITDA (1)

$

195.2

$

119.4

$

75.8


Years Ended

December 31, 

(In millions)

2024

2023

Change

Net Income

$

476.4

$

297.1

$

179.3

Subtract:

Interest income

(48.3)

(36.0)

(12.3)

Add:

Interest expense

7.5

12.2

(4.7)

Add:

Income taxes

123.0

75.9

47.1

Add:

Depreciation and amortization

153.1

142.2

10.9

Add:

Dry-dock amortization

27.2

25.3

1.9

EBITDA (1)

$

738.9

$

516.7

$

222.2

(1)

EBITDA is defined as earnings before interest, income taxes, depreciation and amortization (including deferred dry-docking amortization). EBITDA should not be considered as an alternative to net income (as determined in accordance with GAAP), as an indicator of our operating performance, or to cash flows from operating activities (as determined in accordance with GAAP) as a measure of liquidity. Our calculation of EBITDA may not be comparable to EBITDA as calculated by other companies, nor is this calculation identical to the EBITDA used by our lenders to determine financial covenant compliance.


View original content to download multimedia:https://www.prnewswire.com/news-releases/matson-inc-announces-fourth-quarter-and-full-year-2024-results-provides-2025-outlook-302384252.html

SOURCE Matson, Inc.

Continue Reading

Technology

QuickLogic Reports Fiscal Fourth Quarter and Full Year 2024 Financial Results

Published

on

By

SAN JOSE, Calif. , Feb. 25, 2025 /PRNewswire/ — QuickLogic Corporation (NASDAQ: QUIK) (“QuickLogic” or the “Company”), a developer of embedded FPGA (eFPGA) IP, ruggedized FPGAs and Endpoint AI solutions, today announced its financial results for the fiscal fourth quarter and fiscal year that ended December 29, 2024.

Recent Highlights

Awarded $1.1 million eFPGA Hard IP contract with new defense industrial base customer last weekAnnounced $6.6 million fourth tranche of the Strategic Radiation Hardened FPGA Technology US Government contractOn track to complete the first eFPGA Hard IP core optimized for Intel 18A during Q1Announced the integration of the Synopsys Synplify® synthesis tool into Aurora 2.9 Pro FPGA User ToolsStrengthened sales team with the appointment of former FlexLogix VP Andy Jaros to VP of IP SalesSigned distribution agreement with Magenta to expand distribution network to Turkiye and UAEAnnounced strategic process for SensiML

“With the continued execution on the Strategic Radiation Hardened FPGA contract with the US government, an influx of opportunities after a key competitor exited the market and being the first, and at this time, only company to offer eFPGA Hard IP for Intel 18A, we believe we are well positioned to return to sound revenue growth in 2025,” said Brian Faith, CEO of QuickLogic. “We believe this growth, combined with our ability to leverage the eFPGA Hard IP we have established for six unique fabrication processes and the Hard IP Cores in our library that are being reused; we believe we are very well positioned to achieve non-GAAP profitability and positive cash flow for full-year 2025.”

Fiscal Fourth Quarter 2024 Financial Results

Total revenue for the fourth quarter of fiscal 2024 was $5.7 million, a decrease of 23.7% compared with the fourth quarter of 2023 and an increase of 33.5% compared with the third quarter of 2024.

New product revenue was approximately $4.7 million in the fourth quarter of 2024, a decrease of $2.2 million, or 31.8%, compared with the fourth quarter of 2023 and an increase of $1.1 million, or 31.7%, compared with the third quarter of 2024. The decreases in total revenue and new product revenue from the same period a year ago were mostly due to the timing of awards for certain large eFPGA IP contracts.

Mature product revenue was $1.0 million in the fourth quarter of 2024. This compares to $0.7 million in the fourth quarter of 2023 and $0.7 million in the third quarter of 2024.

Fourth quarter 2024 GAAP gross margin was 59.8% compared with 77.1% in the fourth quarter of 2023 and 55.8% in the third quarter of 2024.

Fourth quarter 2024 non-GAAP gross margin was 62.0% compared with 78.3% in the fourth quarter of 2023 and 60.0% in the third quarter of 2024.

Fourth quarter 2024 GAAP operating expenses were $3.6 million compared with $3.7 million in the fourth quarter of 2023 and $4.2 million in the third quarter of 2024.

Fourth quarter 2024 non-GAAP operating expenses were $2.9 million compared with $3.1 million in the fourth quarter of 2023 and $3.3 million in the third quarter of 2024.

Fourth quarter 2024 GAAP net loss was ($0.3 million), or ($0.02) per share, compared with net income of $2.0 million, or $0.15 per basic share or $0.14 per diluted share, in the fourth quarter of 2023, and a net loss of ($2.1 million), or ($0.14) per share, in the third quarter of 2024.

Fourth quarter 2024 non-GAAP net income was $0.6 million, or $0.04 per share, compared with net income of $2.6 million, or $0.19 per basic share or $0.18 per diluted share, in the fourth quarter of 2023 and a net loss of ($0.9 million), or ($0.06) per share, in the third quarter of 2024.

Conference Call

QuickLogic will hold a conference call at 2:30 p.m. Pacific Time / 5:30 p.m. Eastern Time today, February 25, 2025, to discuss its current financial results. The conference call will be webcast on QuickLogic’s IR Site Events Page at https://ir.quicklogic.com/ir-calendar. To join the live conference, you may dial (877) 407-0792 and international participants should dial (201) 689-8263 by 2:20 p.m. Pacific Time. No Passcode is needed to join the conference call. A recording of the call will be available approximately one hour after completion. To access the recording, please call (844) 512-2921 and reference the passcode 13751688.

The call recording, which can be accessed by phone, will be archived through March 4, 2025, and the webcast will be available for 12 months on the Company’s website.

About QuickLogic

QuickLogic is a fabless semiconductor company that develops innovative embedded FPGA (eFPGA) IP, discrete FPGAs, and FPGA SoCs for a variety of industrial, aerospace and defense, edge and endpoint AI, consumer, and computing applications. Our wholly owned subsidiary, SensiML Corporation, completes the end-to-end solution portfolio with AI / ML software that accelerates AI at the edge/endpoint. For more information, visit www.quicklogic.com.

QuickLogic uses its website (www.quicklogic.com), the company blog (https://www.quicklogic.com/blog/), corporate Twitter account (@QuickLogic_Corp), Facebook page (https://www.facebook.com/QuickLogic), and LinkedIn page (https://www.linkedin.com/company/13512/) as channels of distribution of information about its products, its planned financial and other announcements, its attendance at upcoming investor and industry conferences, and other matters. Such information may be deemed material information, and QuickLogic may use these channels to comply with its disclosure obligations under Regulation FD. Therefore, investors should monitor the Company’s website and its social media accounts in addition to following the Company’s press releases, SEC filings, public conference calls, and webcasts.

Non-GAAP Financial Measures

QuickLogic reports financial information in accordance with United States Generally Accepted Accounting Principles, or U.S. GAAP, but believes that non-GAAP financial measures are helpful in evaluating its operating results and comparing its performance to comparable companies. Accordingly, the Company excludes certain charges related to stock-based compensation, in calculating non-GAAP (i) income (loss) from operations, (ii) net income (loss), (iii) net income (loss) per share, and (iv) gross margin percentage. The Company provides this non-GAAP information to enable investors to evaluate its operating results in a manner like how the Company analyzes its operating results and to provide consistency and comparability with similar companies in the Company’s industry.

Management uses the non-GAAP measures, which exclude gains, losses, and other charges that are considered by management to be outside of the Company’s core operating results, internally to evaluate its operating performance against results in prior periods and its operating plans and forecasts. In addition, the non-GAAP measures are used to plan for the Company’s future periods and serve as a basis for the allocation of the Company’s resources, management of operations and the measurement of profit-dependent cash, and equity compensation paid to employees and executive officers.

Investors should note, however, that the non-GAAP financial measures used by QuickLogic may not be the same non-GAAP financial measures and may not be calculated in the same manner as that of other companies. QuickLogic does not itself, nor does it suggest that investors should, consider such non-GAAP financial measures alone or as a substitute for financial information prepared in accordance with U.S. GAAP. A reconciliation of U.S. GAAP financial measures to non-GAAP financial measures is included in the financial statements portion of this press release. Investors are encouraged to review the related U.S. GAAP financial measures and the reconciliation of non-GAAP financial measures with their most directly comparable U.S. GAAP financial measures.

Forward Looking Statements

This press release contains forward-looking statements within the meaning of the Private Securities Litigation Reform Act of 1995. These forward-looking statements include, without limitation, statements regarding our future profitability and cash flows, expectations regarding our future business and statements regarding the timing, milestones, and payments related to our government contracts, and statements regarding our ability to successfully exit SensiML, and actual results may differ due to a variety of factors including: delays in the market acceptance of the Company’s new products; the ability to convert design opportunities into customer revenue; our ability to replace revenue from end-of-life products; the level and timing of customer design activity; the market acceptance of our customers’ products; the risk that new orders may not result in future revenue; our ability to introduce and produce new products based on advanced wafer technology on a timely basis; our ability to adequately market the low power, competitive pricing and short time-to-market of our new products; intense competition by competitors; our ability to hire and retain qualified personnel; changes in product demand or supply; general economic conditions; political events, international trade disputes, natural disasters and other business interruptions that could disrupt supply or delivery of, or demand for, the Company’s products; and changes in tax rates and exposure to additional tax liabilities. These and other potential factors and uncertainties that could cause actual results to differ materially from the results contemplated or implied are described in more detail in the Company’s public reports filed with the U.S. Securities and Exchange Commission (the “SEC”), including the risks discussed in the “Risk Factors” section in the Company’s Annual Reports on Form 10-K, Quarterly Reports on Form 10-Q and in the Company’s prior press releases, which are available on the Company’s Investor Relations website at http://ir.quicklogic.com/, and on the SEC website at www.sec.gov/. In addition, please note that the date of this press release is February 25, 2025, and any forward-looking statements contained herein are based on management’s current expectations and assumptions that we believe to be reasonable as of this date. We are not obliged to update these statements due to latest information or future events.

QuickLogic and logo are registered trademarks of QuickLogic. All other trademarks are the property of their respective holders and should be treated as such.

CODE: QUIK-E 

 –Tables Follow –


QUICKLOGIC CORPORATION

CONDENSED CONSOLIDATED STATEMENTS OF OPERATIONS

(in thousands, except per share amounts)

(Unaudited) 

Three Months Ended

Year Ended

December 29, 2024

December 31, 2023

September 29, 2024

December 29, 2024

December 31, 2023

Revenue

$

5,705

$

7,479

$

4,273

$

20,112

$

21,198

Cost of revenue

2,292

1,713

1,888

$

8,226

6,711

Gross profit

3,413

5,766

2,385

$

11,886

14,487

Operating expenses:

Research and development

1,604

1,381

1,954

$

6,544

6,448

Selling, general and administrative

2,035

2,269

2,292

$

8,773

7,969

Total operating expense

3,639

3,650

4,246

$

15,317

14,417

Operating income (loss)

(226)

2,116

(1,861)

$

(3,431)

70

Interest expense

(111)

(59)

(186)

$

(406)

(215)

Interest and other (expense) income, net

21

(17)

(34)

$

(1)

(116)

Income (loss) before income taxes

(316)

2,040

(2,081)

$

(3,838)

(261)

(Benefit from) provision for income taxes

(11)

(2)

13

$

3

2

Net income (loss)

$

(305)

$

2,042

$

(2,094)

$

(3,841)

$

(263)

Net income (loss) per share:

Basic

$

(0.02)

$

0.15

$

(0.14)

$

(0.26)

$

(0.02)

Diluted

$

(0.02)

$

0.14

$

(0.14)

$

(0.26)

$

(0.02)

Weighted average shares outstanding:

Basic

14,869

13,989

14,555

14,510

13,453

Diluted

14,869

14,349

14,555

14,510

13,453

Note: Net income (loss) equals to comprehensive income (loss) for all periods presented.


QUICKLOGIC CORPORATION

CONDENSED CONSOLIDATED BALANCE SHEETS

(in thousands)

(Unaudited)

December 29, 2024

December 31, 2023

ASSETS

Current assets:

Cash, cash equivalents and restricted cash

$

21,880

$

24,606

Accounts receivable, net of allowance for doubtful accounts of $30 and $34, as of December 29, 2024 and December 31, 2023, respectively

2,436

1,625

Contract assets

2,682

3,609

Note receivable, current

1,200

Inventories

940

2,029

Prepaid expenses and other current assets

1,666

1,561

Total current assets

29,604

34,630

Property and equipment, net

16,077

8,948

Capitalized internal-use software, net

2,451

2,069

Right of use assets, net

758

981

Intangible assets, net

430

537

Non-marketable equity investment

300

300

Goodwill

185

185

Inventories, non-current

718

Note receivable, non-current

1,292

Other assets

118

142

TOTAL ASSETS

$

51,933

$

47,792

LIABILITIES AND STOCKHOLDERS’ EQUITY

Current liabilities:

Revolving line of credit

$

18,000

$

20,000

Trade payables

3,120

4,657

Accrued liabilities

1,611

2,673

Deferred revenue

454

1,052

Notes payable, current

1,928

946

Lease liabilities, current

284

302

Total current liabilities

25,397

29,630

Long-term liabilities:

Lease liabilities, non-current

447

681

Notes payable, non-current

1,202

461

Other long-term liabilities

125

Total liabilities

27,046

30,897

Commitments and contingencies

Stockholders’ equity:

Preferred stock, $0.001 par value; 10,000 shares authorized; no shares issued and outstanding

Common stock, $0.001 par value; 200,000 authorized; 15,336 and 14,118 shares issued and outstanding as of December 29, 2024 and December 31, 2023, respectively

15

14

Additional paid-in capital

334,268

322,436

Accumulated deficit

(309,396)

(305,555)

Total stockholders’ equity

24,887

16,895

TOTAL LIABILITIES AND STOCKHOLDERS’ EQUITY

$

51,933

$

47,792


QUICKLOGIC CORPORATION

SUPPLEMENTAL RECONCILIATIONS OF US GAAP AND NON-GAAP FINANCIAL MEASURES

(in thousands, except per share amounts and percentages)

(Unaudited)

Three Months Ended

Year Ended

December 29, 2024

December 31, 2023

September 29, 2024

December 29, 2024

December 31, 2023

US GAAP income (loss) from operations

$

(226)

$

2,116

$

(1,861)

$

(3,431)

$

70

Adjustment for stock-based compensation within:

Cost of revenue

122

89

180

627

328

Research and development

171

82

323

1,048

595

Selling, general and administrative

575

434

645

2,706

1,599

Non-GAAP income (loss) from operations

$

642

$

2,721

$

(713)

$

950

$

2,592

US GAAP net income (loss)

$

(305)

$

2,042

$

(2,094)

$

(3,841)

$

(263)

Adjustment for stock-based compensation within:

Cost of revenue

122

89

180

627

328

Research and development

171

82

323

1,048

595

Selling, general and administrative

575

434

645

2,706

1,599

Non-GAAP net income (loss)

$

563

$

2,647

$

(946)

$

540

$

2,259

US GAAP net income (loss) per share, basic

$

(0.02)

$

0.15

$

(0.14)

$

(0.26)

$

(0.02)

Adjustment for stock-based compensation

0.06

0.04

0.08

0.30

0.19

Non-GAAP net income (loss) per share, basic

$

0.04

$

0.19

$

(0.06)

$

0.04

$

0.17

US GAAP net income (loss) per share, diluted

$

(0.02)

$

0.14

$

(0.14)

$

(0.26)

$

(0.02)

Adjustment for stock-based compensation

0.06

0.04

0.08

0.30

0.19

Non-GAAP net income (loss) per share, diluted

$

0.04

$

0.18

$

(0.06)

$

0.04

$

0.17

US GAAP gross margin percentage

59.8

%

77.1

%

55.8

%

59.1

%

68.3

%

Adjustment for stock-based compensation included in cost of revenue

2.2

%

1.2

%

4.2

%

3.1

%

1.6

%

Non-GAAP gross margin percentage

62.0

%

78.3

%

60.0

%

62.2

%

69.9

%


QUICKLOGIC CORPORATION

SUPPLEMENTAL DATA

(Unaudited)

Percentage of Revenue

Change in Revenue

Q4 2024

Q4 2023

Q3 2024

Q4 2024 to Q4 2023

Q4 2024 to Q3 2024

COMPOSITION OF REVENUE

Revenue by product: (1)

New products

82

%

91

%

83

%

(32)

%

32

%

Mature products

18

%

9

%

17

%

61

%

42

%

Revenue by geography:

Asia Pacific

9

%

6

%

12

%

28

%

5

%

North America

86

%

92

%

86

%

(29)

%

33

%

Europe

5

%

2

%

2

%

90

%

208

%

_____________________

(1)

New products include all products manufactured on 180 nanometer or smaller semiconductor processes, eFPGA IP intellectual property, professional services, and QuickAI and SensiML AI software as a service (SaaS) revenue. Mature products include all products produced on semiconductor processes larger than 180 nanometer and includes related royalty revenue.


View original content to download multimedia:https://www.prnewswire.com/news-releases/quicklogic-reports-fiscal-fourth-quarter-and-full-year-2024-financial-results-302385240.html

SOURCE QuickLogic Corporation

Continue Reading

Trending