
Technology
Ginkgo Bioworks Reports Fourth Quarter and Full Year 2023 Financial Results
Published
1 year agoon
By
$251 million of Total revenue in 2023
$139 million in Cell Engineering services revenue, representing 31% growth over 2022
78 new Cell Programs added in 2023, representing 32% growth over 2022 and continued penetration in biopharma
Year-end cash balance of nearly $950 million provides meaningful multi-year runway as we drive towards profitability and begin recognizing benefits from improved platform efficiency
BOSTON, Feb. 29, 2024 /PRNewswire/ — Ginkgo Bioworks Holdings, Inc. (NYSE: DNA, “Ginkgo”), which is building the leading platform for cell programming and biosecurity, today announced its results for the fourth quarter and year ended December 31, 2023. The update, including a webcast slide presentation and supplemental financial information, will be available at investors.ginkgobioworks.com.
“2023 was a breakout year for Ginkgo,” said Jason Kelly, co-founder and CEO of Ginkgo. “We’re working to build a durable platform that fundamentally transforms R&D in biotech. I’m particularly pleased with our growth in biopharma, which represents our largest untapped market – we added several new programs across modalities with large enterprises including Boehringer Ingelheim, Merck, Novo Nordisk, and Pfizer and are seeing strong momentum in pharma going into 2024. I am also thrilled to see a real ecosystem building around Ginkgo – we’re honored by the trust placed in us by the terrific founders of Patch Biosciences, Reverie Labs, and Proof Diagnostics to bring their technologies to customers and by the over 25 inaugural partners in our newly announced Technology Network. We are committed to bringing the best technologies together to support our customers, and we’ve never been better positioned to deliver.”
Recent Business Highlights & Strategic Positioning
Added 78 new Cell Engineering Programs in 2023, representing 32% growth over the prior year periodGinkgo’s Cell Engineering segment generated services revenue, which does not include downstream value share revenue, of $139 million in 2023, a 31% increase versus 2022Ginkgo’s Biosecurity segment generated $108 million of revenue in 2023 as the Biosecurity business shifted to a more recurring model focused on global reach and multiple pathogens to build a long-term biosecurity global infrastructureGinkgo continues to expand its global bioradar network—now in 14 countries and 10 airports—and advance capabilities for multi-target and multimodal biological threat detection, characterization, and forecasting for next-generation biological intelligenceGinkgo is partnering with the Qatar Free Zones Authority (QFZ) and Doha Venture Capital (DVC) to build a Center for Unified Biosecurity Excellence in Doha (CUBE-D), envisioned as the first of several hubs for biosecurity sample and data analysis in our global networkGinkgo is partnering with Illumina, a global leader in DNA sequencing and array-based technologies, to advance localized biosecurity capabilities in countries around the worldDownstream value share – which consists of potential value to Ginkgo from its Cell Engineering customers and includes potential royalties, milestone payments, and equity interests – is an important component of the financial potential of most programs. As of December 31, 2023 Ginkgo has approximately $2.4 billion in aggregate revenue potential from downstream milestone payments alone in addition to royalties.Ginkgo recently announced the launch of its Technology Network of over 25 companies, creating a more integrated approach to biotech R&D. Ginkgo has a long history of integrating diverse technologies to deliver on customers’ complex program goals and believes that customers should not have to choose a technical approach prematurely but should be able to test many approaches in an unbiased way. Ginkgo customers will be able to benefit from the integration of technologies from network partners in their programs, and Ginkgo expects to expand the network based on customer needs and feedback.Ginkgo also announced several acquisitions including Patch Biosciences, Proof Diagnostics and Reverie Labs. These acquisitions are expected to expand Ginkgo’s capabilities in AI and biopharma.
Fourth Quarter 2023 Financial Highlights
Fourth quarter 2023 Total revenue of $35 million, down from $98 million in the comparable prior year period, a decrease of 65% primarily driven by the expected ramp down of K-12 testing in Ginkgo’s Biosecurity segment and the impact of Cell Engineering downstream value share from equity milestones in 2022 that did not recur in 2023Fourth quarter 2023 Cell Engineering services revenue, which does not include downstream value share revenue, of $27 million, down 26% from $36 million in the comparable prior year period. There was no material downstream value share revenue received in the fourth quarter of 2023.Fourth quarter 2023 Biosecurity revenue of $8 million with gross profit margin of 15% is reflective of the early stages of transitioning to a more recurring business modelFourth quarter 2023 Loss from operations of $(178) million (inclusive of stock-based compensation expense of $44 million), compared to Loss from operations of $(231) million in the comparable prior year period (inclusive of stock-based compensation expense of $111 million). Just under half of the stock-based compensation expense relates to the continued GAAP accounting for the modification of restricted stock units issued prior to Ginkgo becoming a public company, as disclosed in our annual report on Form 10-K filed with the SEC on March 13, 2023, and which we expect to continue to ramp down significantly in the coming quarters.Fourth quarter 2023 Adjusted EBITDA of $(96) million, down from $(76) million in the comparable prior year period driven by the decline in Total revenue partially offset by a decline in operating expensesCash and cash equivalents balance as of the end of the fourth quarter of $944 million puts Ginkgo in a strong financial position to pursue its strategic objectives
Full Year 2023 Financial Highlights
Full year 2023 Total revenue of $251 million, down from $478 million in the prior year, a decrease of 47% as Biosecurity revenue transitioned from K-12 testing to a more recurring business modelFull year 2023 Cell Engineering revenue of $144 million remained stable over the prior year, representing 31% growth in services revenue offset by a decrease in downstream value share from equity milestonesFull year 2023 Biosecurity revenue of $108 million, down from $334 million in the prior year, a decrease of 68%, with full year 2023 Biosecurity gross profit margin of 50%Full year 2023 Loss from operations of $(864) million (inclusive of stock-based compensation expense of $235 million), compared to $(2.2) billion (inclusive of stock-based compensation expense of $1.9 billion) in the prior yearFull year 2023 Adjusted EBITDA of $(355) million, down from $(173) million in the prior year
Full Year 2024 Guidance
Ginkgo expects to add 100-120 new Cell Programs to the Cell Engineering platform in 2024Ginkgo expects Total revenue of $215–$235 million in 2024Ginkgo expects Cell Engineering services revenue of $165-185 million in 2024 driven by expected growth in biopharma and government programs. This guidance excludes the impact of any potential downstream value share revenue.Ginkgo expects Biosecurity revenue in 2024 of at least $50 million, representing approximate current contracted backlog, with potential upside from additional opportunities in the pipeline
Conference Call Details
Ginkgo will host a videoconference today, Thursday, February 29, 2024, beginning at 5:30 p.m. ET. The presentation will include an overview of the fourth quarter and full year financial performance, recent business updates, a discussion on Ginkgo’s outlook, as well as a moderated question and answer session.
To ask a question ahead of the presentation, please submit your questions to @Ginkgo on X (hashtag #GinkgoResults) or by sending an e-mail to investors@ginkgobioworks.com.
A webcast link is available on Ginkgo’s Investor Relations website and a replay will be made available following the presentation.
Ginkgo Investor Website: https://investors.ginkgobioworks.com/events/
Audio-Only Dial Ins:
+1 646 876 9923 (New York)
+1 301 715 8592 (Washington DC)
+1 312 626 6799 (Chicago)
+1 669 900 6833 (San Jose)
+1 253 215 8782 (Tacoma)
+1 346 248 7799 (Houston)
+1 408 638 0968 (San Jose)
Webinar ID: 928 9136 7332
If you experience technical difficulties with any of these dial-ins or if you need international dial-in numbers, please visit our web site at https://investors.ginkgobioworks.com/events/ for updated dial-in information.
About Ginkgo Bioworks
Ginkgo Bioworks is the leading horizontal platform for cell programming, providing flexible, end-to-end services that solve challenges for organizations across diverse markets, from food and agriculture to pharmaceuticals to industrial and specialty chemicals. Ginkgo’s biosecurity and public health unit, Concentric by Ginkgo, is building global infrastructure for biosecurity to empower governments, communities, and public health leaders to prevent, detect and respond to a wide variety of biological threats. For more information, visit ginkgobioworks.com and concentricbyginkgo.com, read our blog, or follow us on social media channels such as X (@Ginkgo and @ConcentricByGBW), Instagram (@GinkgoBioworks), Threads (@GinkgoBioworks) or LinkedIn.
Forward-Looking Statements of Ginkgo Bioworks
This press release, the presentation, and the conference call and webcast contain certain forward-looking statements within the meaning of the federal securities laws, including statements regarding our plans, strategies, including with respect to our balance sheet and cash runway, acquisitions, current expectations, operations and anticipated results of operations, both business and financial, including opportunities for increased operational efficiency, our manufacturing capabilities, potential customer success, including successful application of our offerings by our customers, the capabilities and potential operational and financial success of our acquisitions, partnerships and collaborations, and expected timing thereof, expectations with regard to revenue, the nature of such revenue and any related downstream value share associated with such revenue, funding that is contingent upon Ginkgo’s achievement of milestones, expenses, including our stock-based compensation expenses, our full year 2024 outlook, the future security and commercial applications of the BIOINT industry, the expansion, timing and potential capabilities of our bioradar network and the national biodefense strategy, plans to develop and deploy AI tools for biology and biosecurity for both internal use and external release, including the expected timing thereof, and the market environment, all of which are subject to known and unknown risks, uncertainties and other factors that may cause our actual results, performance or achievements, market trends, or industry results to differ materially from those expressed or implied by such forward-looking statements. These forward-looking statements generally are identified by the words “believe,” “can,” “project,” “potential,” “expect,” “anticipate,” “estimate,” “intend,” “strategy,” “future,” “opportunity,” “plan,” “may,” “should,” “will,” “would,” “will be,” “will continue,” “will likely result,” and similar expressions. Forward-looking statements are predictions, projections and other statements about future events that are based on current expectations and assumptions and, as a result, are subject to risks and uncertainties. Many factors could cause actual future events to differ materially from the forward-looking statements in this document, including but not limited to: (i) volatility in the price of Ginkgo’s securities due to a variety of factors, including changes in the competitive and highly regulated industries in which Ginkgo operates and plans to operate, variations in performance across competitors, and changes in laws and regulations affecting Ginkgo’s business, (ii) the ability to implement business plans, forecasts, and other expectations, and to identify and realize additional business opportunities, (iii) the risk of downturns in demand for products using synthetic biology, (iv) the uncertainty regarding the demand for passive monitoring programs and biosecurity services, (v) changes to the biosecurity industry, including due to advancements in technology, emerging competition and evolution in industry demands, standards and regulations, (vi) the outcome of any pending or potential legal proceedings against Ginkgo, (vii) our ability to realize the expected benefits from and the success of our Foundry platform programs, (viii) our ability to successfully develop engineered cells, bioprocesses, data packages or other deliverables, and (ix) the product development or commercialization success of our customers. The foregoing list of factors is not exhaustive. You should carefully consider the foregoing factors and the other risks and uncertainties described in the “Risk Factors” section of Ginkgo’s most recent quarterly report on Form 10-Q filed with the U.S. Securities and Exchange Commission (the “SEC”), and other documents filed by Ginkgo from time to time with the SEC. These filings identify and address other important risks and uncertainties that could cause actual events and results to differ materially from those contained in the forward-looking statements. Forward-looking statements speak only as of the date they are made. Readers are cautioned not to put undue reliance on forward-looking statements, and Ginkgo assumes no obligation and does not intend to update or revise these forward-looking statements, whether as a result of new information, future events, or otherwise. Ginkgo does not give any assurance that it will achieve its expectations.
Use of Non-GAAP Financial Measures
Certain of the financial measures included in this release, including Adjusted EBITDA, have not been prepared in accordance with generally accepted accounting principles (“GAAP”), and constitute “non-GAAP financial measures” as defined by the SEC. Ginkgo has included these non-GAAP financial measures because it believes they provide an additional tool for investors to use in evaluating Ginkgo’s financial performance and prospects. Due to the nature and/or size of the items being excluded, such items do not reflect future gains, losses, expenses or benefits and are not indicative of our future operating performance. These non-GAAP financial measures are supplemental to, and should not be considered in isolation from, or as an alternative to, financial measures determined in accordance with GAAP. In addition, these non-GAAP financial measures may differ from non-GAAP financial measures with comparable names used by other companies. See the reconciliation below for additional information regarding certain of the non-GAAP financial measures included in this release, including a description of these non-GAAP financial measures and a reconciliation of the historic measures to Ginkgo’s most comparable GAAP financial measures.
Ginkgo Bioworks Contacts:
INVESTOR CONTACT:
investors@ginkgobioworks.com
MEDIA CONTACT:
press@ginkgobioworks.com
Ginkgo Bioworks Holdings, Inc.
Condensed Consolidated Balance Sheets
(in thousands, except per share data, unaudited)
As of December 31,
2023
2022
Assets
Current assets:
Cash and cash equivalents
$ 944,073
$ 1,315,792
Accounts receivable, net
17,157
80,907
Accounts receivable – related parties
742
1,558
Prepaid expenses and other current assets
39,777
51,822
Total current assets
1,001,749
1,450,079
Property, plant and equipment, net
188,193
314,773
Operating lease right-of-use assets
206,801
400,762
Investments
78,565
112,188
Equity method investments
—
1,543
Intangible assets, net
82,741
111,041
Goodwill
49,238
60,210
Other non-current assets
58,055
88,725
Total assets
$ 1,665,342
$ 2,539,321
Liabilities and Stockholders’ Equity
Current liabilities:
Accounts payable
$ 9,323
$ 10,451
Deferred revenue
44,486
47,817
Accrued expenses and other current liabilities
110,051
114,694
Total current liabilities
163,860
172,962
Non-current liabilities:
Deferred revenue, net of current portion
158,062
174,767
Operating lease liabilities, non-current
221,835
413,256
Warrant liabilities
5,700
10,868
Other non-current liabilities
18,733
31,191
Total liabilities
568,190
803,044
Stockholders’ equity:
Preferred stock, $0.0001 par value; 200,000 shares authorized; none issued
—
—
Common stock, $0.0001 par value
199
190
Additional paid-in capital
6,385,997
6,136,378
Accumulated deficit
(5,290,528)
(4,397,659)
Accumulated other comprehensive income (loss)
1,484
(2,632)
Total stockholders’ equity
1,097,152
1,736,277
Total liabilities and stockholders’ equity
$ 1,665,342
$ 2,539,321
Ginkgo Bioworks Holdings, Inc.
Condensed Consolidated Statements of Operations and Comprehensive Loss
(in thousands, except per share data, unaudited)
Three Months Ended December 31,
Year Ended December 31,
2023
2022
2023
2022
Cell Engineering revenue
$ 26,976
$ 53,257
$ 143,531
$ 143,666
Biosecurity revenue:
Product
—
12,431
28,949
35,455
Service
7,779
32,597
78,975
298,585
Total revenue
34,755
98,285
251,455
477,706
Costs and operating expenses:
Cost of Biosecurity product revenue
—
7,447
7,481
20,646
Cost of Biosecurity service revenue
6,611
22,771
46,524
183,570
Research and development
117,038
177,548
580,621
1,052,643
General and administrative
89,223
121,383
385,025
1,429,799
Impairment of lease assets
—
—
96,210
—
Total operating expenses
212,872
329,149
1,115,861
2,686,658
Loss from operations
(178,117)
(230,864)
(864,406)
(2,208,952)
Other income (expense):
Interest income
13,303
11,441
57,217
20,262
Interest expense
(93)
(106)
(93)
(106)
Loss on equity method investments
(1,119)
10,003
(2,635)
(43,761)
Loss on investments
(10,012)
(13,354)
(54,827)
(53,335)
Change in fair value of warrant liabilities
6,555
28,871
5,168
124,970
(Loss) gain on deconsolidation of subsidiaries
(42,502)
—
(42,502)
31,889
Other income (expense), net
93
6,161
9,138
7,634
Total other income (expense), net
(33,775)
43,016
(28,534)
87,553
Loss before income taxes
(211,892)
(187,848)
(892,940)
(2,121,399)
Income tax benefit
(198)
(14,770)
(71)
(15,027)
Net loss
(211,694)
(173,078)
(892,869)
(2,106,372)
Loss attributable to non-controlling interest
—
2,390
—
(1,443)
Net loss attributable to Ginkgo Bioworks Holdings, Inc. stockholders
$ (211,694)
$ (175,468)
$ (892,869)
$ (2,104,929)
Net loss per share attributable to Ginkgo Bioworks Holdings, Inc.
common stockholders:
Basic
$ (0.11)
$ (0.09)
$ (0.46)
$ (1.25)
Diluted
$ (0.11)
$ (0.10)
$ (0.46)
$ (1.25)
Weighted average common shares outstanding:
Basic
1,977,708
1,854,952
1,944,420
1,679,061
Diluted
1,978,843
1,856,610
1,944,420
1,679,839
Comprehensive loss:
Net loss
$ (211,694)
$ (173,078)
$ (892,869)
$ (2,106,372)
Other comprehensive loss:
Foreign currency translation adjustment
4,383
5,278
4,116
(917)
Total other comprehensive gain (loss)
4,383
5,278
4,116
(917)
Comprehensive loss
$ (207,311)
$ (167,800)
$ (888,753)
$ (2,107,289)
(1)
R&D and G&A expenses included a significant charge for stock-based compensation expense as a result of the modification of the vesting terms of RSUs and related earnout shares. Total stock-based compensation expense, inclusive of employer payroll taxes, was allocated as follows (in thousands):
Three Months Ended December 31,
Year Ended December 31,
(in thousands)
2023
2022
2023
2022
Research and development
$ 26,775
$ 68,171
$ 148,861
$ 738,821
General and administrative
16,809
43,059
86,047
1,202,099
Total
$ 43,584
$ 111,230
$ 234,908
$ 1,940,920
Ginkgo Bioworks Holdings, Inc.
Condensed Consolidated Statements of Cash Flows
(in thousands, unaudited)
Year Ended December 31,
2023
2022
Cash flows from operating activities:
Net loss
$ (892,869)
$ (2,106,372)
Adjustments to reconcile net loss to net cash used in operating activities:
Depreciation and amortization
70,507
42,552
Stock-based compensation
229,884
1,930,641
Non-cash customer consideration
(1,373)
(34,263)
Loss on equity method investments
2,635
43,761
Loss on investments
54,827
53,335
Change in fair value of notes receivable
2,416
(3,757)
Change in fair value of warrant liabilities
(5,168)
(124,970)
Change in fair value of contingent consideration liability
9,168
(1,262)
Loss (gain) on deconsolidation of subsidiaries
42,502
(31,889)
Impairment of long-lived assets
121,404
—
Deferred income tax benefit
(801)
(14,609)
Loss on disposal of equipment
842
3,091
Non-cash lease expense
28,313
19,082
Non-cash in-process research and development
9,182
1,162
Amortization of finance lease right-of-use assets
1,047
1,871
Non-cash severance and retention bonus expense associated with an acquisition
—
6,152
Other non-cash activity
2,147
283
Changes in operating assets and liabilities:
Accounts receivable
50,068
55,024
Prepaid expenses and other current assets
10,473
(8,523)
Operating lease right-of-use assets
9,275
13,233
Other non-current assets
2,570
921
Accounts payable
(1,183)
(10,844)
Accrued expenses and other current liabilities
16,899
(39,639)
Deferred revenue, current and non-current
(35,917)
(36,417)
Operating lease liabilities, current and non-current
(22,800)
(10,792)
Other non-current liabilities
452
31
Net cash used in operating activities
(295,500)
(252,198)
Cash flows from investing activities:
Purchases of property and equipment
(40,801)
(52,271)
Deconsolidation of subsidiaries – cash
(42,980)
(55,721)
Business acquisitions, net of cash acquired
—
82,367
Asset acquisitions, net of cash acquired
—
(7,639)
Purchases of notes receivable
(350)
(40,000)
Proceeds from notes receivable
—
10,000
Purchase of investment in equity securities
—
(3,691)
Proceeds from sale of equipment
4,428
—
Other
(990)
(439)
Net cash used in investing activities
(80,693)
(67,394)
Cash flows from financing activities:
Proceeds from exercise of stock options
93
240
Taxes paid related to net share settlement of equity awards
(23)
(981)
Principal payments on finance/capital leases and lease financing obligation
(1,295)
(1,237)
Proceeds from public offering, net of issuance costs
—
99,303
Contingent consideration payment
(1,411)
(521)
Payment of equity issuance costs
(580)
(1,467)
Net cash (used in) provided by financing activities
(3,216)
95,337
Effect of foreign exchange rates on cash and cash equivalents
(588)
908
Net decrease in cash, cash equivalents and restricted cash
(379,997)
(223,347)
Cash and cash equivalents, beginning of period
1,315,792
1,550,004
Restricted cash, beginning of period
53,789
42,924
Cash, cash equivalents and restricted cash, beginning of period
1,369,581
1,592,928
Cash and cash equivalents, end of period
944,073
1,315,792
Restricted cash, end of period
45,511
53,789
Cash, cash equivalents and restricted cash, end of period
$ 989,584
$ 1,369,581
Ginkgo Bioworks Holdings, Inc.
Selected Non-GAAP Financial Measures
(in thousands, unaudited)
Three Months Ended December 31,
Year Ended December 31,
(in thousands)
2023
2022
2023
2022
Net loss attributable to Ginkgo Bioworks Holdings, Inc. stockholders
$ (211,694)
$ (175,468)
$ (892,869)
$ (2,104,929)
Interest income
(13,226)
(11,412)
(57,217)
(20,262)
Interest expense
15
77
93
106
Income tax benefit
(198)
(14,770)
(71)
(15,027)
Depreciation and amortization
12,837
15,667
70,507
42,552
EBITDA
(212,266)
(185,906)
(879,557)
(2,097,560)
Stock-based compensation (1)
43,584
111,230
234,908
1,940,920
Impairment of long-lived assets (2)
—
—
121,404
—
Merger and acquisition related expenses (3)
23,663
26,045
70,771
46,229
Loss on investments
10,012
13,354
54,827
53,335
Loss (gain) on deconsolidation of subsidiaries
42,502
—
42,502
(31,889)
Loss on equity method investments (4)
1,119
(7,612)
2,635
45,315
Change in fair value of warrant liabilities
(6,555)
(28,871)
(5,168)
(124,970)
Change in fair value of notes receivable
2,174
(3,924)
2,295
(4,153)
Adjusted EBITDA
$ (95,767)
$ (75,684)
$ (355,383)
$ (172,773)
(1)
For the years ended December 31, 2023 and 2022, includes $5.0 million and $10.3 million, respectively, in related employer payroll taxes.
(2)
For the year ended December 31, 2023, includes $25.2 million impairment loss on lab equipment and $96.2 million impairment loss on a right-of-use asset and the related leasehold improvements associated with an exited Zymergen leased facility.
(3)
Represents transaction and integration costs directly related to mergers and acquisitions, including: (i) due diligence, legal, consulting and accounting fees associated with acquisitions, (ii) post-acquisition employee retention bonuses and severance payments, (iii) the fair value adjustments to contingent consideration liabilities resulting from acquisitions, (iv) acquired intangible assets expensed as in-process research and development, and (v) costs associated with the Zymergen Bankruptcy, as well as securities litigation costs, net of insurance recovery.
(4)
Represents losses on equity method investments under the hypothetical liquidation at book value method, net of losses attributable to non-controlling interests.
Ginkgo Bioworks Holdings, Inc.
Segment Information
(in thousands, unaudited)
Three Months Ended December 31,
Year Ended December 31,
2023
2022
2023
2022
Revenue:
Cell Engineering
$ 26,976
$ 53,257
$ 143,531
$ 143,666
Biosecurity
7,779
45,028
107,924
334,040
Total revenue
34,755
98,285
251,455
477,706
Segment cost of revenue:
Biosecurity
6,611
30,218
54,005
204,216
Segment research and development expense:
Cell Engineering
77,999
95,408
353,493
273,356
Biosecurity
191
590
1,599
1,937
Total segment research and development expense
78,190
95,998
355,092
275,293
Segment general and administrative expense:
Cell Engineering
60,047
63,686
215,263
168,586
Biosecurity
12,652
13,670
55,514
56,353
Total segment general and administrative expense
72,699
77,356
270,777
224,939
Segment operating (loss) income:
Cell Engineering
(111,070)
(105,837)
(425,225)
(298,276)
Biosecurity
(11,675)
550
(3,194)
71,534
Total segment operating loss
(122,745)
(105,287)
(428,419)
(226,742)
Operating expenses not allocated to segments:
Stock-based compensation (1)
43,584
111,230
234,908
1,940,920
Impairment of long-lived assets
—
—
121,404
—
Depreciation and amortization
12,837
15,667
70,507
42,552
Change in fair value of contingent consideration liability
(1,049)
(1,320)
9,168
(1,262)
Loss from operations
$ (178,117)
$ (230,864)
$ (864,406)
$ (2,208,952)
(1)
Includes $5.0 million and $10.3 million in related employer payroll taxes for the years ended December 31, 2023 and 2022, respectively.
View original content to download multimedia:https://www.prnewswire.com/news-releases/ginkgo-bioworks-reports-fourth-quarter-and-full-year-2023-financial-results-302076484.html
SOURCE Ginkgo Bioworks

You may like
Technology
ASTRI Triumphs at International Exhibition of Inventions Geneva, Clinching 16 Awards
Published
32 minutes agoon
April 13, 2025By
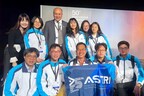
HONG KONG, April 13, 2025 /PRNewswire/ — The Hong Kong Applied Science and Technology Research Institute (ASTRI) has made a stellar showcasing at the 50th International Exhibition of Inventions Geneva, securing 16 awards. These include 1 Gold Medal with Jury Congratulations, 4 Gold Medals, along with 7 Silver Medals and 4 Bronze Medals. The award-winning projects feature cutting-edge technologies such as artificial intelligence (AI), 3D integrated circuits, 5G communications, blockchain and visual sensing, with wide-ranging applications in various sectors, promising to benefit both industry and the public.
Ir Sunny Lee, Board Chairman of ASTRI, expressed his delight of the institute’s achievements. “This success not only reflects the global recognition of Hong Kong’s innovation and technology (I&T) research excellence but also underscores our commitment to accelerating commercialisation of research outcomes.”
He said that the strong backing from both the central and HKSAR governments have created unprecedented opportunities for the I&T sector. ASTRI, he added, remains dedicated to aligning with government policies and strategic development blueprints, while fostering collaboration across government, industry, academia, research and investment sector aiming to support Hong Kong-developed technologies to go global.
Dr Ying Huang, Acting CEO and Chief Technology Officer of ASTRI, highlighted the dedication of the ASTRIANs. “Each award-winning invention reflects the relentless efforts of our teams and validates their excellence in high-quality research.”
He was pleased to learn that ASTRI’s technologies, recognised as practical solutions to industry pain points, were well-received by the judges. “With the tremendous support from the HKSAR government and the industry, we are committed to enhancing Hong Kong’s competitiveness through technology, ensuring that more people benefit from our research outcomes,” he added.
Two winning innovations were co-developed by ASTRI and the MTR Corporation. The “Automatic Tunnel Inspections System” won the Gold Medal with Jury Congratulations, while the “Power Demand Optimisation AI Cohort” won the Gold Medal.
The International Exhibition of Inventions Geneva, held from 9 to 13 April, is one of the world’s premier events celebrating innovation. This year’s exhibition brings together over 1,000 inventions from 45 countries and regions, with awards selected by an international panel of expert judges.
Awards
Inventors
Invention Name and Description
Gold Medal
Chi Wai
Neville NG,
Suk Ling
Elaine LEE
Tiny Machine Learning Platform for Computation
Optimisation
A standalone tiny machine learning device utilising optimised
Convolutional Neural Network (CNN) architecture and
algorithms designed for environments with limited resources,
power, and latency requirements. CNNs, widely deployed in
artificial intelligence applications including voice command
recognition on edge devices, are reimagined through this
hardware platform specifically engineered to reduce
computational complexity via block float point calculations.
Gold Medal
Yuelin WANG,
Ziqi WANG,
Chun ZHANG
Continuous Line for Automatic Diamond Colour Grading
This is a sophisticated automated diamond colour-grading
machine capable of continuous assessment with ±0.5 grade
accuracy. This revolutionary technology uses standard
unbiased internal references to evaluate loose ‘diamonds’
colour grade, eliminating subjective human assessment and
standardising the valuation process throughout the gemstone
industry.
Gold Medal
Meijing TIAN,
Ting Hei WAN,
Caiyun MIAO,
Nan LUO,
Xueyan TANG,
Jinbo JIANG
Dynamic Hybrid-frequency Spatial-carrier Deflectometry-
based 3D Inspection System
This invention introduces a high-resolution dynamic 3D defect
inspection system tailored for thin films in new energy
applications. Unlike traditional 2D inspection methods, it
excels in identifying 3D defects that can cause short circuits
or overheating in batteries. It is also adaptable for inspecting
a wide range of specular surfaces on motion production lines,
ensuring versality and reliability in industrial settings.
Silver Medal
Huimin GUO,
Wenchao WU,
Chun Kit LAU
A Portable Automatic Control System for Capsule
Endoscopy in Stomach
This revolutionary capsule endoscopy system offering
automated and precise stomach examination solution.
Employing cutting-edge control algorithms and 3D
reconstruction technology, this system delivers enhanced
diagnostic accuracy whilst significantly reducing costs,
making gastrointestinal evaluations more accessible to
patients.
Silver Medal
Yan WANG,
Tao LI,
Wing Ki YEUNG
Efficient Data Storage Methods for AI Computing
Revolutionise AI capabilities with this groundbreaking solution
addressing surging storage demands and energy
consumption. By harnessing unique AI data characteristics,
this innovation delivers efficient compression and resource
allocation, substantially reducing storage requirements and
power usage, realising a more intelligent and sustainable
data management for tomorrow’s technological landscape.
Silver Medal
Ying DONG,
Xiaodong WANG,
Yau Yau Yolanda TSANG,
Simon Yee WONG
Autonomous Connectivity Suite for Critical 5G
Applications
In mission-critical 5G applications such as autonomous
vehicles and smart cities, stability is paramount to prevent
costly downtime. This innovation, featuring Stream Control
Transmission Protocol (SCTP) with automatic reconnection,
enhances logistics communication, ensuring timely inventory
updates and highly-efficient operations. The technology
reduces expenses and operational inefficiencies through
superior connectivity and resilience.
Silver Medal
Xun CHEN,
Liqiong LIU,
Zizhou WANG,
Eddy CHIU
5G-Enabled Remote Crane Control and Site Coverage for
Safer Construction Sites
The construction sector is increasingly adopting advanced
technologies, including crane control systems and IoT
sensors, to bolster safety and efficiency whilst relying on
stable uplink transmission. This breakthrough proposes
dynamic uplink resource allocation technology, incorporating
5G uplink efficiency with bandwidth part switching and
DMRS-based multi-user scheduling to enhance
communication quality and spectrum efficiency, addressing
industry challenges while improving workplace safety.
Silver Medal
Tacitus HUI,
George CHEN,
Stella ZHU,
Dongzhe SU
Generative Pretrained Large Traffic
Model for Multi-Modal Traffic Data Understanding
This pioneering invention presents a traffic data
understanding method utilising a generative pretrained
model. The process encompasses multi-modality data
collection, feature extraction via tokenisation, and
comprehensive model training. By analysing this novel data
language, researchers can understand and forecast how
various traffic factors influence one another, revolutionising
urban planning.
Silver Medal
Ming Wai Alwin TAM,
Malik Saad SULTAN,
Xiuling ZHU,
Kin Lung Kenny CHAN
Dynamic Vision Sensing System with A Static Capturing
Mode
This state-of-the-art invention redefines vision sensing
system by overcoming the limitations of traditional Dynamic
Vision Sensors (DVS). It seamlessly detects both dynamic
and static objects through a combination of advanced optics,
artificial intelligence, and innovative modular components.
The result is precise action recognition delivered in a
compact, energy-efficient design, making it a breakthrough in
modern sensing technology.
Silver Medal
Ming Wai Alwin TAM,
Samuel POON,
Zhiqi YAO,
Tony CHOW,
Peisong HUA,
Kwok Sing CHENG,
Kin Lung Kenny CHAN
Optical Digital Encoding-Decoding System
This invention integrates optical methods with digital
encoding techniques to revolutionise secure anti-
counterfeiting measures in printed materials. By utilising
Resonant Waveguide Gratings (RWG) for image encoding, it
employs angular multiplexing and aperiodic diffraction
gratings to enhance image visibility. This sophisticated
system strengthens verification processes in security
applications while ensuring confidentiality across diverse data
sets, offering a robust solution to counterfeiting challenges.
Bronze Medal
Eric TSANG,
Jingwei XIE,
Vincent LOI
Implementation Method of Ultrasonic Echo Envelope
Detection
A breakthrough method for ultrasonic echo envelope
detection has emerged, markedly improving signal-to-noise
ratio and sensor SoC performance. IC design firms can now
leverage these bespoke solutions for precision detection,
creating immense industrial opportunities, especially this
technology strengthens safety features in automotive
ultrasonic sensors, contributing to safer roadways.
Bronze Medal
Chan Fai LAM,
Man Yuen CHENG,
Tsz Yu CHEUNG,
Wei Lun Alan CHEUNG
Identity Non-Fungible Token for Identity Verification in
Metaverse & Online Services
A blockchain-based identity authentication system leveraging
identity NFTs to bridge Web3, blockchain and real-world
identification through verifiable credentials. Users
demonstrate ownership of accounts and wallets, with records
maintained on an immutable blockchain. The system employs
sophisticated cryptography and zero-knowledge proofs for
secure verification, strengthening privacy and security for
third-party identity confirmation in digital environments.
Bronze Medal
Alan HON,
Qijun ZHU,
Li XU,
Yacheng Peter LI,
Likai PENG,
Tao YU
System and Method for PDF Document Semantic Parsing
Combining Visual and Textual Features
This innovative solution transforms PDF document parsing by
introducing a Document Layout Classification Model that
categorises elements using statistical rules based on images,
layouts and text. It employs a Semantic Recovery Technique
for complex components and Text Structure Rules to
maintain hierarchical organisation, enhancing accuracy and
usability for subsequent natural language processing tasks
across multiple sectors.
Bronze Medal
Pui Ho LAM,
Tze Yui HO,
Man Tik LI,
Jingyi XU,
Wai Cheong KU
An Algorithm and Edge Computing Method for Urban
Noise Pollution Monitoring
This cutting-edge solution addresses real-time noise
monitoring, establishing a robust communication platform
linking edge computing devices with distributed sensors. It
features automated, decentralised intelligence for noise
detection and classification, employing a CNN+Shift+Pitch
engine for precise identification. The dual communication
network, combining LoRa and 4G technologies, optimises
data transmission and bandwidth efficiency in urban
environments.
Photos Download: https://bit.ly/3XZj9FZ
-END-
About ASTRI
Hong Kong Applied Science and Technology Research Institute (ASTRI) was founded by the Government of the Hong Kong Special Administrative Region in 2000 with the mission of enhancing Hong Kong’s competitiveness through applied research. ASTRI’s core R&D competence in various areas is grouped under five Technology Divisions: Advanced Electronic Components and Systems; Artificial Intelligence and Trust Technologies; Communications Technologies; Intelligent Perception and Control Technologies, and IoT Sensing and AI Technologies. It is applied across six core areas which are Smart City, Financial Technologies, New Industrialisation and Intelligent Manufacturing, Digital Health, Application Specific Integrated Circuits and Metaverse.
Over the years, ASTRI has nurtured a pool of research, I&T talents and received numerous international awards for its pioneering innovations as well as outstanding business and community contributions. ASTRI has transferred more than 1,500 technologies to the industry and has been granted over 1,100 patents in the Mainland, the United States, and other countries. For further information, please visit www.astri.org.
View original content to download multimedia:https://www.prnewswire.com/apac/news-releases/astri-triumphs-at-international-exhibition-of-inventions-geneva-clinching-16-awards-302427094.html
SOURCE Hong Kong Applied Science and Technology Research Institute (ASTRI)
Technology
Elm AI Secures $2 Million to Revolutionize Supply Chain Sustainability and Performance in Oversubscribed Round
Published
3 hours agoon
April 13, 2025By
Elm AI, a Cornell University spinout and an AI-driven platform helping enterprises improve sustainability and operational performance across their supply chains, has successfully raised $2 million in an oversubscribed funding round. The round was led by Beta Boom Fund and Working Capital Fund, with participation from Boro Capital Partners, Very Serious Ventures, Gorges Ventures, The Bond Collective, and Textbook Ventures.
NEW YORK, April 12, 2025 /PRNewswire-PRWeb/ — Elm AI, a Cornell University spinout and an AI-driven platform helping enterprises improve sustainability and operational performance across their supply chains, has successfully raised $2 million in an oversubscribed funding round. The round was led by Beta Boom Fund and Working Capital Fund, with participation from Boro Capital Partners, Very Serious Ventures, Gorges Ventures, The Bond Collective, and Textbook Ventures.
Global enterprises continue to face escalating costs and complexity in supplier due diligence and compliance management, driven by rapidly evolving regulatory standards. Elm AI’s advanced AI-driven technology streamlines this process by automating analysis of supplier documentation (questionnaires, audit reports, etc), and instantly providing actionable insights and recommendations—dramatically faster and more cost-effectively than traditional methods.
Elm AI’s software is already trusted by a diverse range of customers, from mid-sized apparel brands to publicly listed multinational corporations generating billions in revenue. The platform currently manages data from several thousand factories globally. Amongst the company’s first few customers is Reformation, a leading sustainability clothing brand.
“Elm AI has been instrumental in transforming our responsible sourcing process, streamlining cumbersome administrative tasks and giving brands more time to focus on what matters most — building programs and management systems that benefit workers by ensuring safe, healthy, and equitable working conditions.”
– Carrie Freiman Parry, Senior Director Of Sustainability at Reformation
The company was founded in 2023 at Cornell University by Advait Raykar, Aparajita Thakker, Ken He, and Eesha Khanna. Elm AI was built on cutting-edge research of AI applications in the sustainability space, and initially secured funding from Cornell University and Entrepreneurs Roundtable Accelerator. Since then, the company has grown exponentially.
“The Elm AI team’s maturity and focus on solving customer problems continue to impress me. As someone with a long history in supply chain labor and sustainability, it’s refreshing to see such enthusiasm for making a real difference. They’ve made me a firm believer in AI’s ability to accelerate our efforts to support workers in global supply chains.”
– James McMichael, Founder of ELEVATE Global and Mosaic RSR
The newly raised capital will accelerate Elm AI’s growth, allowing the company to quickly onboard customers from its extensive waitlist and continue expanding its technological capabilities. Elm AI aims to become the definitive platform for managing comprehensive supplier performance and risk data at global scale.
About Elm AI
Elm AI provides an AI-driven system of record for supplier sustainability, performance, and risk data. The platform automates complex workflows, empowering companies to achieve unprecedented efficiency and sustainability in their supply chain operations.
For more information, visit www.elm-ai.com or contact info@elm-ai.com.
Media Contact
Aparajita Thakker, Elm AI, 1 4085680807, aparajita@elm-ai.com, www.elm-ai.com
Advait Raykar, Elm AI, 1 9783629319, advait@elm-ai.com, www.elm-ai.com
View original content to download multimedia:https://www.prweb.com/releases/elm-ai-secures-2-million-to-revolutionize-supply-chain-sustainability-and-performance-in-oversubscribed-round-302426277.html
SOURCE Elm AI
Technology
“Zhejiang’s Fine Products” debut at the 5th CICPE
Published
3 hours agoon
April 13, 2025By
New Consumption Trends, New Technological Forces
HAIKOU, China, April 13, 2025 /PRNewswire/ — From April 13 to 18, the 5th China International Consumer Products Expo (CICPE) is held in Haikou, Hainan. A key highlight is the debut of the Exhibition of “Zhejiang’s Fine Products: A Legacy of Excellence” at the China Chic section. Companies such as Lingban Technology (Rokid’s parent company), OSM, and Hu Qing Yu Tang unveil global product launches at the event.
Themed on “New Consumption Trends, New Technological Forces,” the exhibition shows Zhejiang’s ambition to integrate heritage craftsmanship with cutting-edge innovation. With the slogan “World-Class Quality, Made in Zhejiang,” visitors experience a hybrid exhibit combining physical displays and virtual interactions. The cultural section highlights time-honored industries, with 18 brands presenting over 200 products, from traditional crafts to modern consumer goods. A virtual exhibition, co-developed with Alibaba’s Taobao & Tmall Group, extends the showcase digitally.
A major event in the CICPE’s official agenda is the global product launch session, themed “New Discoveries at the CICPE: Global Premieres.” On April 14, three innovations are unveiled: the AI+AR Rokid Glasses, OSM’s 2025 edition of Soothing Whitening Essence, and Hu Qing Yu Tang’s “Light Wellness: Workplace Saviors” series for health-conscious young professionals.
Throughout the exhibition, Zhejiang Satellite TV’s VR hostess, Gu Xiaoyu, serves as the “digital news officer,” providing real-time updates. The exhibition also introduces interactive experiences that engage sight, sound, smell, taste, and touch to explore Zhejiang’s historical products. Traditional crafts such as Dongyang wood carving, Wanfeng joinery, traditional Chinese medicine from Hu Qing Yu Tang, and Longjing tea from Shibake are showcased.
Prominent figures lend their support to the Zhejiang brand initiative, including Zhu Zhu, advertising spokesperson for OSM Skincare; Shen Zhirong, Founder of OSM known as OSM “Grandpa Pearl”; Zhu Mingming, Rokid’s Founder and CEO; and Chen Yunhan, Board Chairman and General Manager of Hu Qing Yu Tang. The exhibition attracts significant attention from both domestic and international media. Through live broadcasts, press conferences, and short video promotions, organizers seek to elevate the profile of Zhejiang’s brands on the global stage—part of China’s broader strategy to enhance the international competitiveness of its consumer goods sector.
View original content:https://www.prnewswire.co.uk/news-releases/zhejiangs-fine-products-debut-at-the-5th-cicpe-302425773.html


ASTRI Triumphs at International Exhibition of Inventions Geneva, Clinching 16 Awards
Bitcoiners were first to realize US economic data ‘was wrong’ — Pompliano

Elm AI Secures $2 Million to Revolutionize Supply Chain Sustainability and Performance in Oversubscribed Round

Whiteboard Series with NEAR | Ep: 45 Joel Thorstensson from ceramic.network

New Gooseneck Omni Antennas Offer Enhanced Signals in a Durable Package

Huawei Launches Global City Intelligent Twins Architecture to Accelerate City Digital Transformation

Why You Should Build on #NEAR – Co-founder Illia Polosukhin at CV Labs
Whiteboard Series with NEAR | Ep: 45 Joel Thorstensson from ceramic.network

NEAR End of Year Town Hall 2021: The Open Web World, MetaBUILD 2 Hackathon and 2021 recap
Trending
-

 Near Videos3 days ago
DevHub Live 45 – Developer News Recap
-

 Technology1 day ago
UN Global Compact and private sector move to accelerate progress on SDGs in Africa
-

 Technology4 days ago
Wondershare Filmora Partners with AMA to Empower Future Marketers Through Creative Video Storytelling
-
 Technology5 days ago
GOURMA CHOOSES SOLLUM TECHNOLOGIES’ FULLY DYNAMIC LED LIGHTING SOLUTION
-

 Technology4 days ago
Trinasolar launches the Shield extreme climate solution in Asia Pacific, safeguarding PV power plant assets
-

 Technology5 days ago
DuPont™ Tyvek® Trifecta™ Wins 2025 Edison Award
-
Coin Market5 days ago
Crypto execs expect global banking push into Bitcoin by end of 2025
-

 Technology4 days ago
AXA, Ant Bank (Hong Kong) and AlipayHK Forge Strategic Partnership